Fig. 4
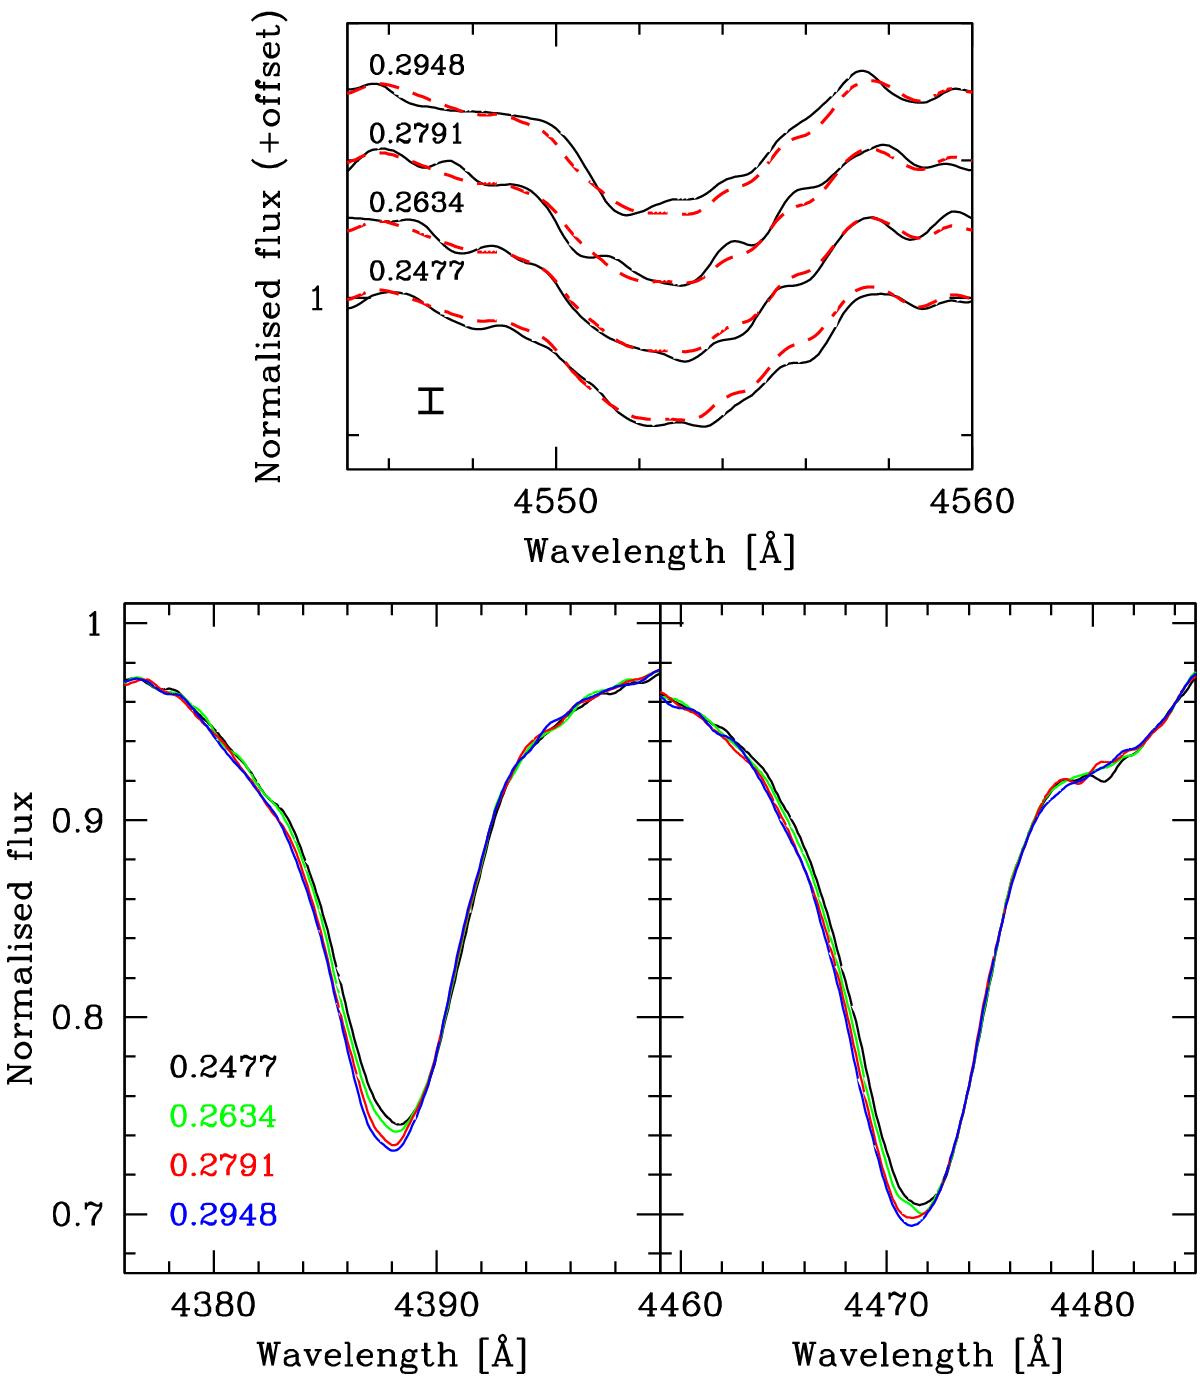
Line profile variability of Si and He in the FORS 2 Stokes I spectra of HD 345439 obtained for each subexposure pair, i.e. with a time lapse of 22 min. The top panel presents the behaviour of the Si iii λ4553 line. The mean profile is indicated by the red dashed line. The numbers close to the plotted line profiles refer to the time of the observation calculated as MJD-56 810. The vertical bar on the left side shows the noise level. In the bottom panel we present overplotted profiles of the He i λ4388 and He i λ4471 lines. Their intensity is lower at the phase when the polarity of the field is positive and increases when the field is negative. The error bar is too small to be presented in these plots.
Current usage metrics show cumulative count of Article Views (full-text article views including HTML views, PDF and ePub downloads, according to the available data) and Abstracts Views on Vision4Press platform.
Data correspond to usage on the plateform after 2015. The current usage metrics is available 48-96 hours after online publication and is updated daily on week days.
Initial download of the metrics may take a while.