Fig. 1
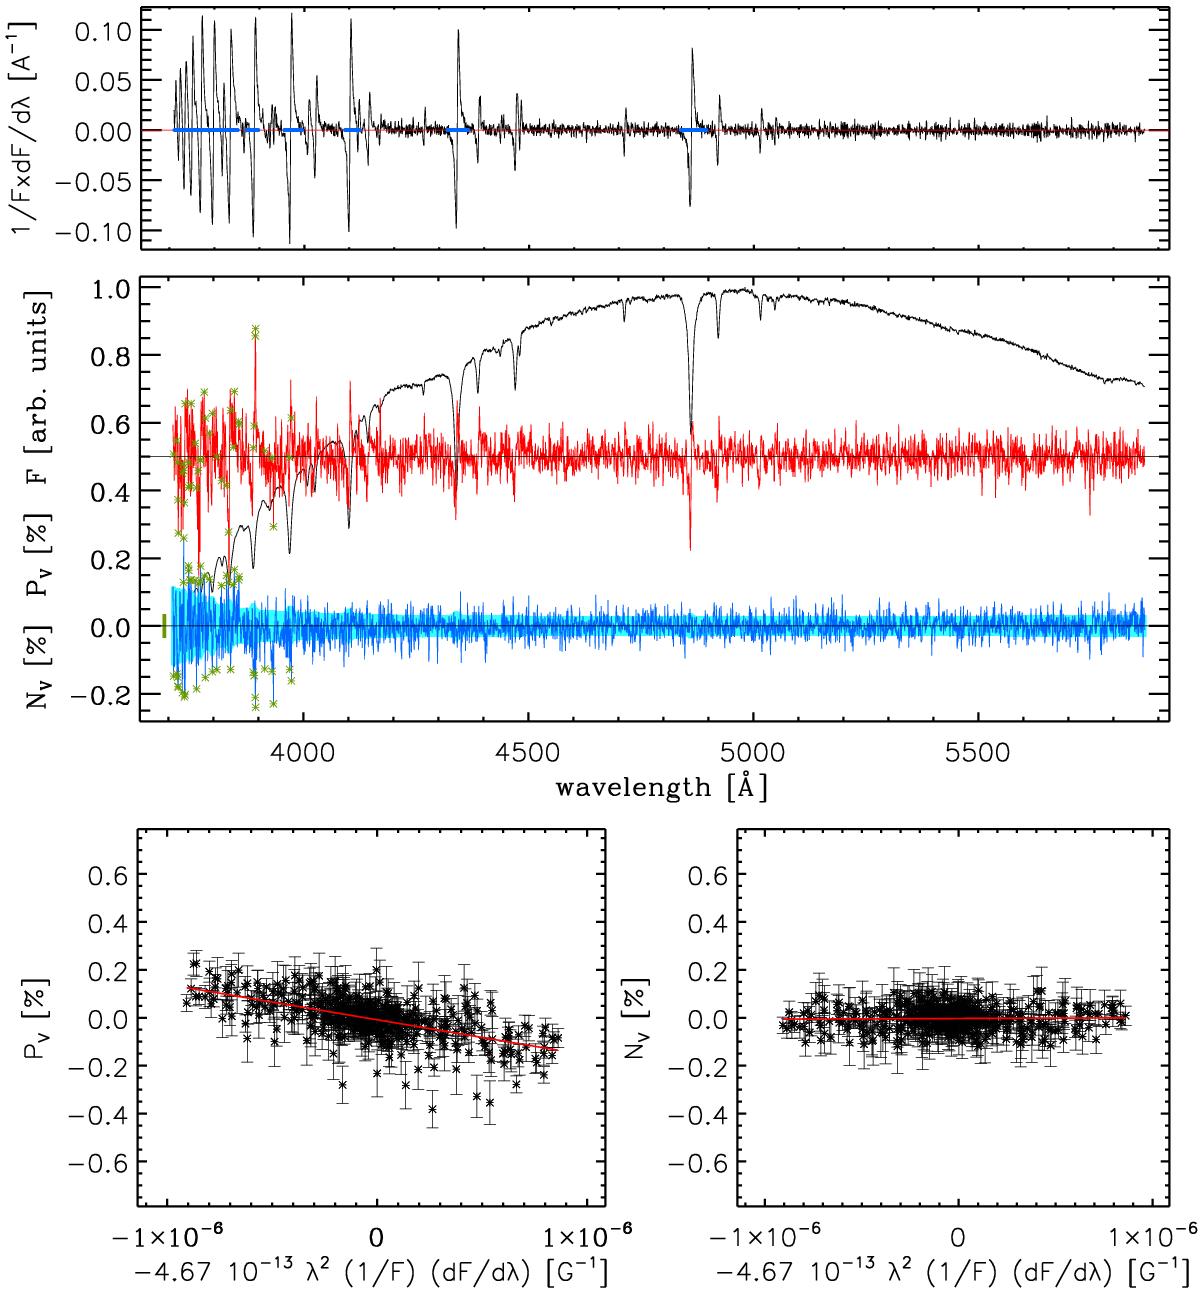
Graphical output of the IRAF/IDL Bonn pipeline obtained from the analysis of the FORS 2 data of the hydrogen lines of HD 23478. The top panel presents the derivative of Stokes I. The regions used to calculate the magnetic field are marked by a thick blue line centred at zero. In the middle panel, the top spectrum presents the Stokes I spectrum arbitrarily normalised to the highest value, the middle red spectrum corresponds to the Stokes V spectrum (in %), while the bottom blue spectrum is the N spectrum (in %). The green asterisks drawn on the Stokes V and N spectra mark the points that have been removed by the sigma clipping. The pale blue strip drawn behind the N spectrum shows the uncertainty associated with each spectral point. As a double-check of the statistical consistency of the data and uncertainties, the thick green bar on the left side of the N spectrum shows the standard deviation of the N profile. In the bottom left panel, we present the linear fit used to determine the magnetic field value using Stokes V (i.e. ⟨Bz⟩). The red solid line shows the best fit. From the linear fit we obtain ⟨Bz⟩ = −1477 ± 95 G. In the bottom right panel, we present the same as in the bottom left panel, but for the null profile (i.e. ⟨Nz⟩). From the linear fit, we obtain ⟨Nz⟩ = 30 ± 64 G.
Current usage metrics show cumulative count of Article Views (full-text article views including HTML views, PDF and ePub downloads, according to the available data) and Abstracts Views on Vision4Press platform.
Data correspond to usage on the plateform after 2015. The current usage metrics is available 48-96 hours after online publication and is updated daily on week days.
Initial download of the metrics may take a while.