Fig. 9
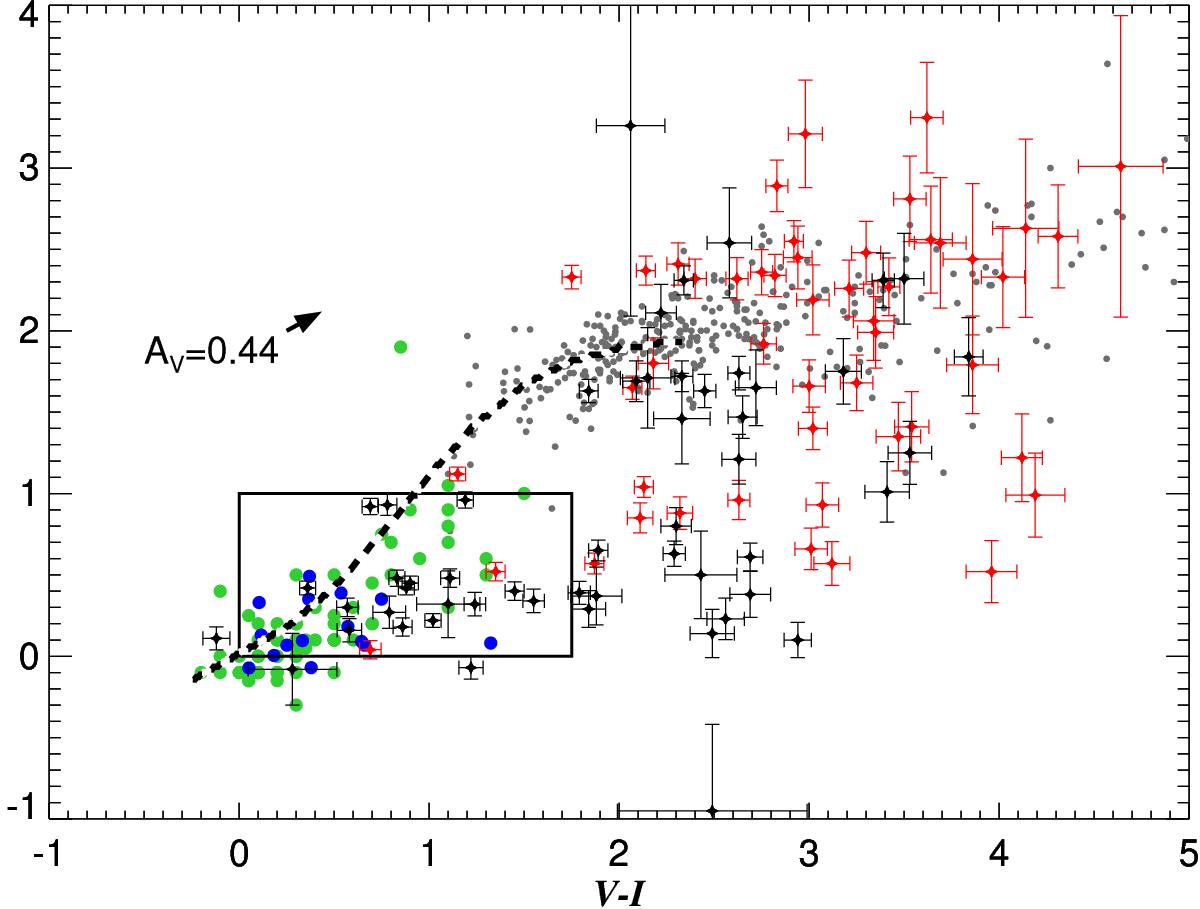
Color−color diagram for M 83 stars with HST photometry. Objects determined to be good candidates for follow-up spectroscopy with rank 1 and 2 are shown in red, while objects with ranks 3 and higher are shown in black. Also plotted is a “typical” V-band reddening for stars in M 83’s central region as reported by Kim et al. (2012). Spectroscopically confirmed RSGs in the Local Group are collectively shown as grey points. The dashed line represents the theoretical supergiant sequence from Bertelli et al. (1994) as used in Grammer & Humphreys (2013). The box outlines the region where cluster candidates are known to exist (Barmby et al. 2006). The blue points are sgB[e] stars from the LMC and SMC (Bonanos et al. 2009, 2010), while the green points are blue supergiants from M 31 and M 33 (Humphreys et al. 2014).
Current usage metrics show cumulative count of Article Views (full-text article views including HTML views, PDF and ePub downloads, according to the available data) and Abstracts Views on Vision4Press platform.
Data correspond to usage on the plateform after 2015. The current usage metrics is available 48-96 hours after online publication and is updated daily on week days.
Initial download of the metrics may take a while.