Fig. 2
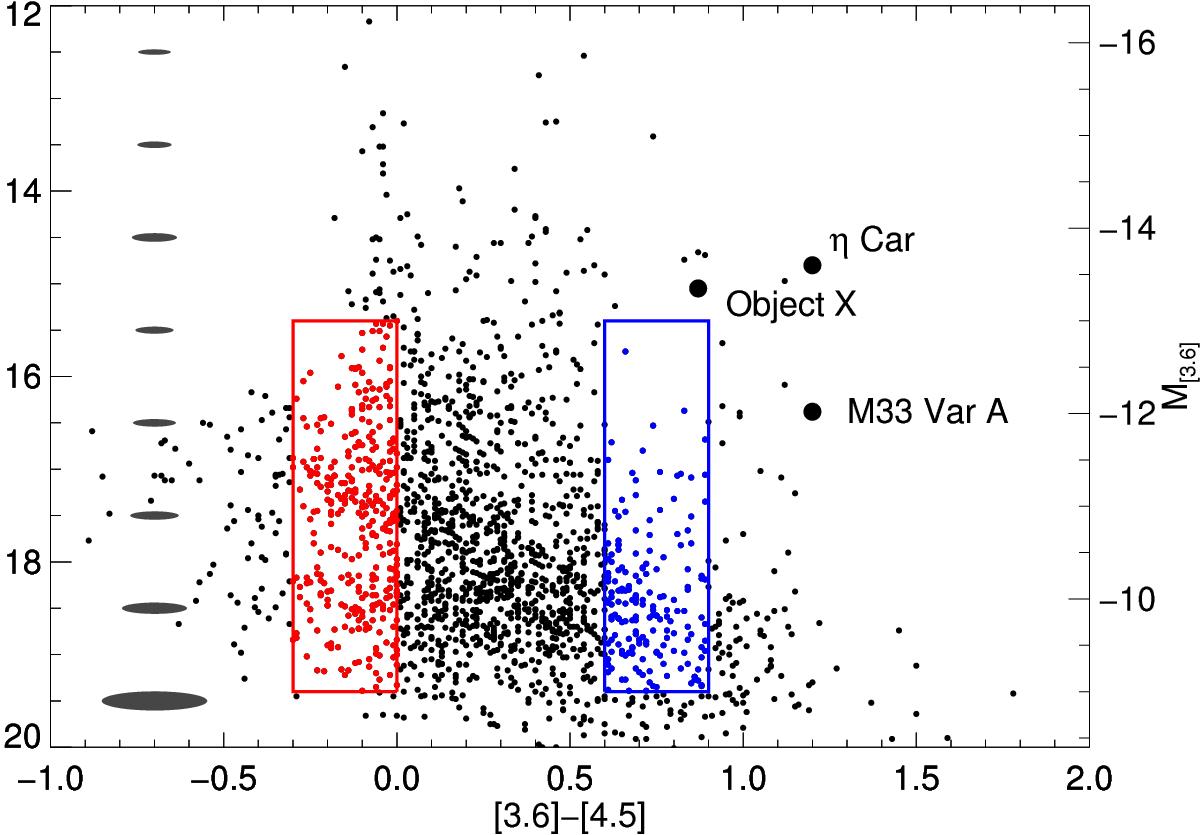
Color−magnitude diagram (CMD) for M 83 based on Spitzer IRAC Bands 1 and 2 photometry. Regions empirically known to contain red supergiants (RSGs) and supergiant Be stars (sgB[e]) in Bonanos et al. (2009, 2010) are outlined with red and blue boxes, respectively. Objects that lie within those regions are plotted with red and blue points. On the left side of the plot are shown the average 1σ uncertainty ellipses for stars in 1 mag bins for the [3.6] photometry and the [3.6]–[4.5] color. For reference, also plotted are the locations of the prominent evolved massive stars η Car (Humphreys & Davidson 1994), M 33 Variable A (Humphreys et al. 2006), and Object X (Khan et al. 2010) when placed at the distance (~4.8 Mpc) of M 83.
Current usage metrics show cumulative count of Article Views (full-text article views including HTML views, PDF and ePub downloads, according to the available data) and Abstracts Views on Vision4Press platform.
Data correspond to usage on the plateform after 2015. The current usage metrics is available 48-96 hours after online publication and is updated daily on week days.
Initial download of the metrics may take a while.