| Issue |
A&A
Volume 578, June 2015
|
|
|---|---|---|
| Article Number | A111 | |
| Number of page(s) | 8 | |
| Section | Planets and planetary systems | |
| DOI | https://doi.org/10.1051/0004-6361/201425518 | |
| Published online | 12 June 2015 | |
Simulation of Titan’s atmospheric photochemistry
Formation of non-volatile residue from polar nitrile ices
1
Aix-Marseille Université, CNRS, PIIM, UMR 7345,
13013
Marseille,
France
e-mail:
This email address is being protected from spambots. You need JavaScript enabled to view it.
2
Ice Spectroscopy Lab, Science Division, Jet Propulsion Laboratory,
California Institute of Technology, Pasadena, CA
91109,
USA
e-mail:
This email address is being protected from spambots. You need JavaScript enabled to view it.
Received: 15 December 2014
Accepted: 20 January 2015
Abstract
We studied the photochemistry of frozen ice of a polar Titan’s atmospheric molecule cyanodiacetylene (HC5N) to determine the possible contribution of this compound to the lower altitude photochemistry of haze layers found on Titan. We used infrared analysis to examine the residue produced by irradiation of solid HC5N at λ > 300 nm. The resulting polymer is orange-brown in color. Based on theoretical analysis and the general tendency of HC5N and C4N2 to undergo similar ice photochemistry at longer wavelengths accessible in Titan’s lower atmosphere, we conclude that Titan’s lower atmosphere is photochemically active in the regions of cloud, ice, and aerosol formation. C4N2is a symmetric molecule with no net dipole moment whereas, HC5N has a large dipole moment of ~4 D. Consequently, though both these molecules have very similar molecular weight and size, their sublimation temperatures are different, HC5N subliming around 170 K compared to 160 K for C4N2. Based on our studies we conclude that in Titan’s atmosphere the cyanoacetylene class of molecules (HCN, HC3N, HC5N, etc.) would condense first followed by the dicyanoacetylenes (C2N2, C4N2, C6N2, etc.), leading to fractionation of different class of molecules. From the fluxes used in the laboratory and depletion of the original HC5N signals, we estimate Titan’s haze ice photochemistry involving polar nitriles to be significant and very similar to their non-polar counterparts.
Key words: planets and satellites: surfaces / ultraviolet: planetary systems / astrochemistry / planets and satellites: atmospheres
Also a senior research scientist at IPST, University of Maryland, College Park, MD 20742, USA.
© ESO, 2015
1. Introduction
Titan, the largest moon of Saturn, mainly made up by nitrogen and methane, is the only moon in the solar system to have a dense atmosphere (1.5 bars on the surface). As a consequence, Titan has attracted significant interest of scientists since July 2004, the arrival of Cassini-Huygens to Saturn. The atmosphere presents a relatively uniform temperature of ~170 K above ~200 km. Below 200 km the temperature drops to 71 K before rising again to a surface temperature of 94 K.
Titan’s atmosphere is made of over 95% N2 and a few percentage of CH4, which are ionized and dissociated in the upper atmosphere by solar extreme-UV, soft X-ray radiation, electronic impact, protons, and oxygens ions (Cravens et al. 2008; Lavvas et al. 2008). The radicals and ions thus formed undergo further chemistry resulting in the formation of various larger hydrocarbons and nitrogen containing molecules (Cui et al. 2009; Teanby et al. 2006; Vinatier et al. 2007; Vuitton et al. 2007). Many of them are expected to be detectable in a large part of the atmosphere and, in some cases at all levels, providing a link between stratospheric and thermospheric chemistry (Lellouch et al. 2010). These molecules are precursors of monomers that aggregate to form aerosols (Tomasko & West 2009). The ion neutral mass spectrometer (INMS) measurement in the upper atmosphere (900−1500 km) reveals the presence of heavy molecules and complex chemistry. The discovery of new species in Titan’s atmosphere has opened new ways to study Titan’s chemistry. Among these species Vuitton et al. (2007) and Lellouch et al. (2010) predicted the presence of HC5N in Titan’s atmosphere to fit the INMS data. Lellouch et al. (2010) evoked for the first time the formation of aerosols in the atmosphere driven by UV radiation. Titan’s aerosols play a critical role in the formation and transport of organic in Titan’s atmosphere and on the surface. They are responsible for the orange-brown color of Titan’s disk. The next step in Titan’s chemical evolution knowledge is the fate of the aerosols once they reach to the surface. Strong evidence for the nitrile ice feature due to HCN, HC3N, and C4N2 exists (Samuelson et al. 1997; Anderson et al. 2010; Khanna et al. 1987; de Kok et al. 2014). We have recently shown that in the condensed-phase molecules such as C4N2 can be photochemically polymerized at longer wavelength photons that penetrate through into the lower atmosphere of Titan (Gudipati et al. 2013; Couturier-Tamburelli et al. 2014a).
It has been noted in numerous occasions (Moore et al. 2010; Toumi et al. 2014a,b) that the interpretation of Titan’s observations depends on the knowledge of the spectra of various molecular solids suspected to be present. Because of the presence of nitrogen in these molecules, the nonsymmetric molecules possess significant dipole moment, which in turn would dictate physical parameters such as condensation temperatures, intermolecular interactions during the nucleation, etc. Based on the temperature variations in Titan’s atmosphere, as we show here, it is likely that polar molecules condense first followed by nonpolar molecules with similar molecular weight. The temperature and physical state knowledge (amorphous or crystalline) are very important for molecular identification. They can cause large frequency shifts and intensity variations of the infrared absorption band. In this paper, we provide for the first time measurements of HC5N that include both amorphous and crystalline phase ices from 4000 to 650 cm-1 at different temperatures. This molecule is taken as precursor of monomer that could aggregate with itself or with other similar organics to form aerosols, which can rain down to the surface. During their sedimentation process, these condensed aerosols (molecular aggregates) absorb the solar radiation that passes through Titan’s atmosphere. As the altitude decreases, the wavelength becomes longer. Hence studying the longer wavelength photochemistry of molecular ices of HC5N is very important to improve our understanding Titan’s atmosphere. Our theoretical analysis and experimental work presented here demonstrates that condensed-phase photochemistry at longer wavelengths is a general phenomenon that should occur on Titan.
In our earlier reports we chose C4N2 (Gudipati et al. 2013; Couturier-Tamburelli et al. 2014a), because this molecule is known to be present in the solid phase of the low atmosphere (Samuelson et al. 1997). Our present study is focused on another molecule of the cyanopolyynes family, HC5N, to determine whether molecules with permanent dipole moment (HC5N) compare with molecules without dipole moment (C4N2) during their photopolymerization process in condensed phase. Particularly, in the crystalline phase, the dipole moment would dictate the orientation of molecules and their packing. Indeed the dipole moment of HC5N is large, around 4 Debye (Moliner et al. 1996). The cyanodiacetylene is known to absorb in the near ultraviolet at 353 nm (Fisher & Ross 2003). From the phosphorescence measurements, the lowest triplet state (T1) of HC5N is located at ~424 nm and we expect (vide infra) singlet-triplet absorption at >300 nm to be amplified due to solid-state effect (Gudipati 1994; Turowski et al. 2010). We have not found to date any report of the photochemical formation of HC5N polymer, and our study reported here is the first observation of such polymerization under simulated Titan’s lower atmospheric conditions.
2. Experimental and theoretical details
2.1. Experimental details
Cyanobutadiyne (HC5N) was synthesized by adapting the method described by Trolez and Guillemin (Trolez & Guillemin 2005), namely the reaction of 1, 3-butadiynyl-tributylstannane with an excess of para-toluenesulfonyl cyanide. The compound was selectively trapped at −80 ° C to remove high boiling-point impurities in the first trap maintained at –40 °C. The volatile impurities were removed by pumping.
The gaseous product is deposited at a 5 × 10⁻¹ mol min-1 rate on a gold-platted copper surface maintained between 10 and 300 K with the help of a model 21 CTI cold head. The warming up of the sample was realized at a 1 Kmin-1 heating rate using a resistive heater along with a Lakeshore mode l331 temperature controller. The UV irradiation (λ > 300 nm) was carried out an Osram 200 W high-pressure mercury lamp equipped with a quartz envelope. The broad band was filtered at λ > 300 nm. The photon flux was estimated to be 2.75 × 10¹⁶ photon cm-2 s-1 (Couturier-Tamburelli et al. 2014b). The infrared spectra of the samples were recorded in reflection-absorption (double absorption) mode between 4000 and 650 cm-1 using a Nicolet Magna 750 FTIR spectrometer with a MCT detector. Each spectrum was averaged over 100 scans and has a 1 cm-1 resolution.
2.2. Theoretical considerations
Titan’s atmosphere consists of several classes of organics, among which the cyanoacetylene class of molecules possess a large dipole moment (Fig. 1 and Table 1), which would form aggregates easily because of dipole-dipole interactions. It may be expected that during the condensed haze formation, the dipole moment driven fractionation of organics could occur, and more molecules with lower dipole moment would remain in the gas-phase, while those with higher dipole moment form condensates. For example, dicyanoacetylene (C4N2) with no dipole moment starts sublimation at 160 K, and it takes HC5N about 10 K more until 170 K to sublime (vide infra) because of dipolar interactions in the ice. Therefore, cyanoacetylenes with inherent large dipole moment are expected to dominate the condensates on Titan at warmer temperatures.
In order to understand the photochemical properties of these molecules in the condensed phase, we carried out semiempirical theoretical computations (Table 1) on the spectroscopic properties of the gas-phase molecules using the INDO/S-SCI method that has been shown to predict electronic excited states with reasonable accuracy (Gudipati 1994; Gudipati et al. 1994). It is evident that the majority of these molecules except HCN and acetylene (C2H2) absorb at wavelengths >300 nm through either S0→S1 (strong) or S0→T1 (weak) transitions. Absorption of light by molecules in the condensed phase (clouds, liquids, ice, or aerosols) can occur at longer wavelengths compared to their isolated molecular counterparts due to polarizability of condensed phase (Marcus 1965), exciton interactions (Kasha 1950; Gudipati 1994), and spin-orbit coupling (Klessinger & Michl 1995). Consequently, absorption of longer wavelength photons may trigger condensed-phase chemical processes to significantly affect low-altitude particle composition in Titan’s atmosphere. In the gas phase small molecules, such as hydrogen cyanide, acetylene, diacetylene, cyanoacetylene, and cyanogen, absorb at shorter wavelengths in the near-ultraviolet region (< 300 nm). Larger conjugated molecules, such as dicyanodiacetylene, cyanodiacetylene, etc., absorb in the visible, at the longer wavelength side of ~350 nm. All these molecules exist in singlet electronic ground state. Thus, absorption due to singlet electronic excitation is often the photochemical reaction initiator. However, the lowest lying triplet excited state is normally around 1 eV below the lowest singlet excited state. Direct photoexcitation from the singlet ground state to triplet excited state is normally forbidden, but has been seen in the condensed phase or in the presence of molecular oxygen, or in the presence of heavy atoms like iodine and bromine (Klein et al. 1999). Under these conditions enhancement of spin-orbit coupling occurs, which increases the transition probability between states with different spin multiplicities (singlets, and triplets, etc.), as clearly demonstrated in the case of >300 nm singlet-triplet absorption-initiated, photopolymerization of ethylene in the presence of molecular oxygen.
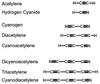 |
Fig. 1 Molecular structures of some acetylenes, cyanoacetylenes, and dicyanoacetylenes, grouped according to their abundance in Titan’s atmosphere (top to bottom). Note that only the cyanoacetylenes have a permanent dipole moment. |
3. Results and discussion
3.1. Infrared spectrum of HC5N
The infrared spectrum of solid HC5N at 10 K has been published earlier (Coupeaud et al. 2008). Here we present full infrared spectrum of pure solid HC5N at different temperatures of 10, 35, 120, and 300 K (Fig. 2) along with the vibrational assignments, comparing with the earlier studies. HC5N is a linear molecule belonging to the Cv group and has 16 normal modes of vibration, which are all infrared active. Five are degenerate (π) and six are nondegenerate mode (Σ). Among these 11 modes, the most intenses are observed in solid phase at ν1 (3210 cm-1), ν2 (2248 cm-1), ν3 (2185 cm-1), and ν4 (2047 cm-1). These bands were previously assigned to νCH, νC≡N and νC≡C (Table 2). Two other bands are observed at 3231 cm-1 attributed to the combination ν3 + ν5 and the first harmonic 2ν5 at 2349 cm-1. In addition to these bands, multiples overtones and combination bands are observed. The solid infrared bands are usually more intense than for molecules trapped in argon matrix, which facilitated the detection of combinations modes and overtones. Some of these infrared bands are assigned by comparison with the gaseous spectrum and previous experiments (Benilan et al. 2007; Coupeaud et al. 2008; Turowski et al. 2010). The other ones are tentatively assigned in this paper (Table 2). For example, since ν9 + ν10 mode observed at 722 cm-1 is intense, we assigned the infrared band observed at 2958 cm-1 to the combination ν2 + ν9 + ν10 mode.
Vibrational frequencies and their assignments for HC5N.
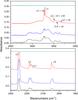 |
Fig. 2 Temperature dependent infrared spectra (recorded in reflection mode, resulting in twice the path length and twice the absorption or double absorption) taken during warm-up period of HC5N with a ramping rate of 1 K / min, 10 K (bottom), 35 K (middle bottom) after the first phase transition, 120 K (middle top) after the end of the second transition and 300 K (top). |
We monitored the phase transition of solid HC5N by annealing the amorphous ice from 10 K to room temperature. As shown in Fig. 3 and in the infrared (IR) spectra, we observed two phase transitions, the first at 35 K and the second at 90 K. The spectra of the most intense bands of HC5N at 10, 35, 120, and 300 K are presented in Fig. 2. The amorphous HC5N ice presents broad and small band (Fig. 2, bottom spectrum), which are transformed into more structured and intense bands after crystallization (Fig. 2, top spectra). Between 10 and 35 K, crystallization of HC5N results in a small change in the position (for example ν2 shifts to lower frequency by ~1 cm-1), and an increase in the intensity of all the infrared absorption bands. The annealing above 35 K promotes further changes. A second step in the crystallization process occurs around 90 K (close to the Titan’s surface temperature). The infrared band assigned to ν4 of the crystalline sample consists of two components at 2048 and 2041 cm-1 for which an intensity inversion is observed. As we previously mentioned (Coupeaud et al. 2008), desorption of HC5N occurs around 170 K. As shown in Fig. 3, HC5N starts to sublime around 140 K, reaches a maximum around 170 K, and the sublimation completes at 180 K. It is important to specify that no residue is obtained at room temperature.
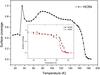 |
Fig. 3 Integrated normalized absorbance of HC5N ν2 mode with temperature (β = 1 K min-1) determined by FTIR spectrometry. Insert compares the temperature dependent surface coverage of HC5N with C4N2. |
As in the case of HCN and HC3N (DelloRusso & Khanna 1996) and already mentioned by Turowski et al. (2010), solid HC5N forms a linear chain of hydrogen-bonded molecules. As a result, the infrared band of the νCH stretching mode is shifted to a lower frequency by ~100 cm-1 and is broader compared to the isolated gas-phase molecules (Table 2).
It is important to remember that all the polyyne molecules present characteristic vibrational mode around 100 cm-1 (or at 100 μm). Far-IR absorption has been calculated at 108 cm-1 (Gronowski & Kolos 2006) in the case of HC5N and could potentially be used to track the presence of solid HC5N on Titan.
3.2. Photolysis experiments
3.2.1. Pure solid HC5N
After deposition at 90 K, we annealed the HC5N at 120 K to obtain a crystalline sample and then cooled back to 90 K before recording the spectrum. The temperature of 90 K is chosen to reproduce the Titan surface temperature. Then, we initially irradiated the HC5N at λ > 400 nm at 90 K. We observed no detectable changes in the HC5N concentration from photolysis at this wavelength. We then subjected the same HC5N ice film to irradiation at λ > 300 nm. Approximately 55% of the HC5N was consumed after 21 hours of irradiation. The infrared spectrum after UV irradiation at 90 K shows the depletion of the HC5N bands and an increase of a broader absorption around the depleted peak due to the polymer formation, which is illustrated for the 2251 cm-1 (νCN) mode in Fig. 4. The evolution of the band located at 2250 cm-1 as a function of the time is fitted by a first order kinetic rate, giving a kinetic constant of 5.16 × 10⁻⁵ ± 8.5 × 10⁻⁶ s-1. Otherwise, because the photon flux of our lamp is 2.75 × 10¹⁶ photon cm-2 s-1, the corresponding photodissociation cross-section for the HC5N is estimated to be σ = 1.87 × 10⁻²¹ photon-1 cm2 at 90 K. The half-life  (Ostwald 1887) given by
  (1)which is determined graphically around 223 min (or 17 520 s) under our experimental condition.
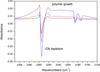 |
Fig. 4 Subtraction spectra obtained after 170 min (low), 330 min (middle), and 1275 min (top) of irradiation at λ > 300 nm. Negative absorbance means depletion of the HC5N bands. Positive absorbance is due to the appearance of polymeric material. |
3.2.2. Infrared spectrum of the HC5N residue
During the warm-up under the vacuum we observed clearly, after sublimation of the nonirradiated HC5N, the spectral feature of nonvolatile photopolymer. The residue, similar to those obtained with C4N2, is orange brown in color and similar to the Titan haze. The infrared spectra of the residue of HC5N irradiation is shown in Fig. 5 compared to the residue obtained after C4N2 irradiation and tholins generated by different methods. Our HC5N residue spectrum presents common tholin absorption bands (Coll et al. 2013; Imanaka et al. 2004, 2012; Couturier-Tamburelli et al. 2014a; Gudipati et al. 2013). We can observe the presence of intense and broad bands in the νNH stretching area due to the presence of amines functions (~3250 cm-1). The 3050 cm-1 band is attributed to –C=C–H stretching. The 2955, 2928, and 2869 bands are attributed to –CH stretching. As a consequence of the molecular formula of HC5N, UV photopolymer has stronger absorption in the CH stretching region. In this area we can see an excellent agreement in the band position and shape bands from HC5N residue and the other tholins obtained in laboratory with different methods (Gautier et al. 2012; Quirico et al. 2008; Khare et al. 1984). As illustrated in Fig. 5, the 2900 cm-1 area is in general agreement with the feature observed by the Cassini Visible and Infrared Mapping Spectrometer (VIMS; Bellucci et al. 2009; Rannou et al. 2010). The presence of νCH spinfrared absorption bands is consistent with the polymer chain formation with CH3 terminal or CH2 internal groups formed by the addition of hydrogen atoms to the unsaturated C=C bonds (reduction processes). Likewise the existence of the νNH absorption band is also in agreement with the existence of amine function in the polymer.
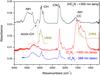 |
Fig. 5 Residue infrared spectrum obtained after HC5N photolysis experiment (top) and C4N2 photolysis experiment (bottom) at room temperature. Complementarity of the photopolymer functional groups is evident in this figure: HC5N polymer is dominated by NH and CH functional groups because of the presence of hydrogen, whereas the C4N2 polymer is dominated by CC functional groups. Also shown in the figure are the IR spectra of C4N2 polymer made with 266 nm laser irradiation at JPL and the spectra of Titan measured by the Cassini VIMS and CIRS instruments. |
The two bands observed at 2263 and 2217 cm-1 can be attributed to nitrile and C≡C stretching modes. The position of the nitrile group, obtained from HC5N photolysis, is shifted to higher frequencies indicating that the C≡N bond is slightly stronger in this tholin compared to the tholins obtained from UV photochemistry of C4N2(2230 cm-1) or from discharges experiments in N2–CH4 gas mixture (Gautier et al. 2011, 2012). The large band around 1580 cm-1 could be attributed either to bending NH, stretching C=N, or C=C double bonds. All these bands are in very good agreement with those obtained by Gautier et al. in their tholins samples (Gautier et al. 2011, 2012).
It is important to note the difference between the refractory residue obtained from the C4N2 photolysis experiment and here. As the photopolymerization of HC5N proceeds via one of its triple bond (C≡C), the resulting polymer probably contains chains formed by conjugated C=C and C≡C bonds. Since, the infrared spectrum of the polymer presents two stretching vibrations at 2263 and 2217 cm-1 and C=C–H stretching, we propose the polymerization process that is illustrated in Fig. 6. As in the case of C4N2 (Couturier-Tamburelli et al. 2014a), the formation of aromatic and polymeric compounds with conjugated double bond (C=C), triple bond (C≡C), and nitrile group (C≡N) are investigated (Fig. 6). The band located around 1580 cm-1 due to stretching C=C is smaller than those observed in the C4N2 experiment, indicating that aromatic structure are less present in this residue. As illustrated in Fig. 6, the polymerization investigated induce the formation of compounds that present double bond conjugated to –C≡C–C≡N, while in the case of C4N2, C=C double bond was only conjugated to C≡N or N=C.
If HC5N photopolymerization is the only process, then we should not have observed any amine function (NH-stretch). However, we see a strong NH-stretch in the polymer spectra. Hence other polymerization processes leading to the formation of NH and CH group must also be active, as shown in the top portion of Fig. 6. Photoisomerization of HC5N leads to the formation of C5NH, which can lead to the NH functional group. This photo-induced H-atom transfer can also occur between two adjacent molecules. Based on the work of He and Smith (He & Smith 2014), in which they put in evidence the formation of aminomalonitrile (C3H3N3) from three HCN molecules, we have supposed that the polymerization of three HC5N molecules could induce an amino compound. This process could explain the presence of the 3400 cm-1 absorption band in our experiment, which could be attributed to the amine function. So we can conclude that we have different polymerization processes in this experiment performed with HC5N.
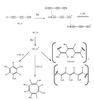 |
Fig. 6 Polymerization processes proposed for HC5N photochemistry at longer wavelength photons (>300 nm), based on the scheme proposed by Clarke & Ferris (1997) for HC3N polymerization. Based on the infrared spectra, we propose possible structures for HC5N polymers. |

3.2.3. Photochemistry of C2H2/HC5N mixture
The UV absorption spectrum of acetylene reported by Price (1935) presents a progression centered on the ν2 mode between 110 and 137 nm and two intense absorption bands at 147 nm (strong) and 151.9 nm (very strong). Two weak absorption bands have been reported between 160 and 200 nm (Herzberg 1931) and between 200 and 235 nm (Benilan et al. 2000). A singlet-triplet absorption is predicted by Malsh et al. (2001) at 346 nm. The C2H2 adsorption on the residue made at 70 K for two reasons. Firstly, the condensation temperature of C2H2 is known to be 81 K (Moore et al. 2010), and secondly, 70 K is the coolest temperature detected in the Titan atmosphere. At this temperature the crystallization of C2H2 is complete.
Our recent study has demonstrated that the cryogenic codeposition of HC5N/C2H2 (Couturier-Tamburelli et al. 2009, 2014b) in Argon matrices induced the formation of a longer carbon–nitrogen chain, cyanotriacetylene (HC7N). We identified this species based on IR vibrational spectroscopy and on electronic luminescence spectroscopy. We confirmed this assignment with the mass spectrometry of gases released during the warm-up of the sample. We demonstrated in our earlier studies that a photoreactivity between HC5N and C2H2 occurs is present at this wavelength, and now we have to check if photochemistry could arrive at wavelengths >300 nm with a solid mixture or in solid phase.
To begin with we performed photolysis experiment on HC5N:C2H2 mixture at 70 K for a duration of 1180 min at λ > 300 nm. During the photolysis roughly 25% of HC5N was consumed, on the other side, the C2H2 was not affected by the photolysis at this wavelength. The infrared monitoring of the irradiation shows that after 1180 min of irradiation, the same polymer infrared bands appear as those observed during the irradiation of pure HC5N solid. Subsequently, we performed photolysis at λ > 250 nm for a total of 240 min on the same sample, which induced an additional loss of 20% of HC5N, and the disappearance of C2H2 is noted to be 3%. The infrared spectrum obtained λ > 250 nm irradiation induces just an increase of the previous infrared bands obtained during the photochemistry at λ > 300 nm.
The evolution under UV irradiation of the absorbance of the band located at 2252 cm-1 (2250 for pure HC5N) as a function of the time is fitted by a first order kinetic rate, giving a kinetic constant of 4.79 × 10⁻⁵ ± 6.1 × 10⁻⁶ s-1. So we estimated the corresponding photodissociation cross-section for the HC5N to σ = 1.74 × 10⁻²¹ photon-1 cm2 at 90 K. In presence of acetylene, the disappearance of HC5N is thus 10% lower than the pure ice, which implies that a C2H2environment slows down the photodegradation of this product at λ > 300 nm.
3.3. Study of the HC5N polymer aging after adsorption of HC5N: interaction of aerosol with HC5N
The Cassini Composite Infrared Spectrometer (CIRS) observations coupled with models of Titan’s stratospheric composition show the interplay between chemistry and dynamics. As noted by Lellouch et al. (2010), the species produced photochemically, like C2H2, present mixing ratios that increase with altitude as a result of their production in the upper part of the atmosphere, and then condensation in the lower part results in a drop. The presence or absence of a given species in the atmosphere or on the aerosol depends on the dynamical and chemical timescales. Thus, it is realistic to assume that aerosols will be covered with different molecular species in different parts of Titan’s atmosphere, which then could be subjected to the photochemical aging process.
In order to determine if the presence of nonvolatile residue in contact with HC5N could induce photochemistry that may be different from the pure HC5N ice, we deposited HC5N on the top of the tholins cooled at 90 K. From the infrared spectra, we determined that the HC5N adsorption at 90 K on the residue surface induces no changes in the infrared band positions of HC5N, indicating that no major interaction between tholins and HC5N exists.
Subsequently, the sample was subjected to 22 h of irradiation with a high-pressure mercury lamp with a filter that allowed λ > 400 nm. No changes in the infrared band intensities of HC5N were observed, indicating no significant photochemistry at these wavelengths. We then changed the filter to allow all the wavelengths above 300 nm (λ > 300 nm), which resulted in significant depletion (around 50%) of HC5N after 22 h of irradiation. At room temperature after HC5N was sublimed, we observed only the increase of intensity of the residue absorption, but no new infrared bands, indicating that HC5N ice on the top of the residue behaves similarly to pure HC5N ice and the products that may be different from the polymer are insignificant when observed in the infrared. Our results show that primary absorbers of light are also the primary photochemical reaction initiators. Both the polymer and HC5N does not have significant absorption at >400 nm, and hence no reactivity. When photons between 300 and 400 nm are also allowed (>300 nm), where HC5N strongly absorbs we immediately see photopolymerization of HC5N on the top of the already formed photopolymer.
4. Implications to Titan atmospheric processes
Using HC5N, another nitrile molecule detected in Titan’s atmosphere, which is isoelectronic with C4N2 (very similar molecular weight and size, number triple bond, but with significant dipole moment), we performed longer wavelength photolysis experiments to understand the photochemistry of Titan’s condensed aerosols at lower altitudes. The spectroscopic and photochemical properties of molecules that condense to form aerosols or condense on already formed aerosols are important to understanding the aerosol dynamics in Titan’s atmosphere. We found that nitriles with permanent dipole moment, such as HC5N, condense at higher temperatures than their counterparts with no dipole moment, such as C4N2. Thus, during the cloud formation and condensation process in Titan’s atmosphere, it is likely that layers of polar and nonpolar nitriles could condense, resulting in fractionation-driven chemistry in Titan’s haze and clouds.
From the fluxes used in the laboratory of ~15 mWcm-2 (~2.75E16 photons cm-2 s-1) and the irradiation time of ~1275 min, which resulted in 50% depletion of the original HC5N signals from a sample of ~500 nm thick ice, we estimate aerosol ice photochemistry involving polar nitriles to be significant and very similar to the nonpolar counterparts that we studied earlier (Gudipati et al. 2013; Couturier-Tamburelli et al. 2014a). We estimated earlier that the photon flux on Titan (200 − 350 nm) ~1014 photons cm-2 s-1 or ~70 μWcm-2, is about 2000 times less than was used in our experiments (Gudipati et al. 2013; Couturier-Tamburelli et al. 2014a). The photopolymerization time for 50% depletion of HC5N corresponds to about 108 s on Titan or about three Earth years on Titan.
The main information available on Titan’s aerosols composition comes from the infrared signatures measured by Cassini Spacecraft using the VIMS instrument in the mid IR and the CIRS instrument in the far-IR. VIMS measurements present absorption at 3030 cm-1, 3000 cm-1, 2965 cm-1, 2930 cm-1, and at 2885 cm-1. Among these bands four (3070 cm-1, 2960 cm-1, 2930 cm-1 and 2870 cm-1) are found in our residue obtained from HC5N photolysis experiment, only the band at 3000 cm-1, attributed to CH3CN by Kim et al. (Kim et al. 2011) is not obtained in our residue. In the VIMS measurements, no absorption band has been found around 3200 cm-1. If this is common among all the aerosols on Titan, then the amine functional groups in Titan aerosols should be a minor component. However, in all the laboratory-made (in cold plasma discharge, spark discharge, and UV generated) tholins Titan aerosol analogs amines function have been a significant part of the infrared signatures of these polymers (Cable et al. 2014). So it is not surprising that our photopolymer also has significant amine contribution, since our initial material, HC5N, contains H bonded to C, but likely during the photolysis migrates to N as well.
In conclusion, though the polymerization process is similar, the photoproduct polymer is significantly different between the two isoelectronic molecules, C4N2 and HC5N. Unlike C4N2 photopolymer, which shows better match only with VIMS data, the infrared spectrum of the residue coming from HC5N photolysis has equally good match with both VIMS and CIRS data. The HC5N polymer shows significant CH stretching, similar to that found in the VIMS data, as well as from tholins obtained from CH4/N2 photolysis (Couturier-Tamburelli et al. 2014a,b), indicating that Titan’s aerosol could be a mix of different types of cross-polymers. Some inconsistencies between the Cassini VIMS and CIRS data and spectra of laboratory analogs still need to be investigated. For example, intense NH stretching absorption seen in the laboratory simulations around 3200 − 3500 cm-1 is not observed in the VIMS data and strong C=C stretching in the lab spectra around 1500 cm-1 is not detected in the CIRS data.
Acknowledgments
This work was funded by the French National Program Environnements Planétaires et Origines de la Vie (EPOV). The JPL part of the work is partly supported by several of the following funding sources: NASA Astrobiology Institute team “Titan as a Prebiotic Chemical System”, the Jet Propulsion Laboratory Director’s Research and Development Fund, and the JPL Research and Technology Development funding for the infrastructure of the ice spectroscopy laboratory (ISL) and Titan organic aerosol spectroscopy and chemistry (TOAST) laboratory at JPL. Research carried out at the Jet Propulsion Laboratory, California Institute of Technology was under a contract with the National Aeronautics and Space Administration. We thank Mr. Tim Hempel for helping in preparing the manuscript to be suitable for the A&A format.
References
- Anderson, C. M., Samuelson, R. E., Bjoraker, G. L., & Achterberg, R. K. 2010, Icarus, 207, 914 [NASA ADS] [CrossRef] [Google Scholar]
- Bellucci, A., Sicardy, B., Drossart, P., et al. 2009, Icarus, 201, 198 [NASA ADS] [CrossRef] [Google Scholar]
- Benilan, Y., Smith, N., Jolly, A., & Raulin, F. 2000, Plan. Space Sci., 48, 463 [NASA ADS] [CrossRef] [Google Scholar]
- Benilan, Y., Jolly, A., Trolez, Y., Raulin, F., & Guillemin, J. C. 2007, J. Mol. Spectr., 245, 109 [NASA ADS] [CrossRef] [Google Scholar]
- Botschwina, P., Heyl, A., Oswald, M., & Hirano, T. 1997, Spectrochimica Acta Part a-Molecular and Biomolecular Spectroscopy, 53, 1079 [Google Scholar]
- Cable, M. L., Hoerst, S. M., He, C., et al. 2014, Earth Plan. Sci. Lett., 403, 99 [NASA ADS] [CrossRef] [Google Scholar]
- Clarke, D. W., & Ferris, J. P. 1997, Icarus, 127, 158 [NASA ADS] [CrossRef] [Google Scholar]
- Coll, P., Navarro-Gonzalez, R., Szopa, C., et al. 2013, Planet. Space Sci., 77, 91 [NASA ADS] [CrossRef] [Google Scholar]
- Coupeaud, A., Kolos, R., Couturier-Tamburelli, I., Aycard, J. P., & Pietri, N. 2006, J. Phys. Chem. A, 110, 2371 [CrossRef] [Google Scholar]
- Coupeaud, A., Pietri, N., Aycard, J. P., & Couturier-Tamburelli, I. 2007, Phys. Chem. Chem. Phys., 9, 3985 [CrossRef] [Google Scholar]
- Coupeaud, A., Pietri, N., Allouche, A., Aycard, J. P., & Couturier-Tamburelli, I. 2008, J. Phys. Chem. A, 112, 8024 [CrossRef] [Google Scholar]
- Couturier-Tamburelli, I., Sessouma, B., Coupeaud, A., Aycard, J. P., & Pietri, N. 2009, Chem. Phys., 358, 13 [NASA ADS] [CrossRef] [Google Scholar]
- Couturier-Tamburelli, I., Gudipati, M. S., Lignell, A., Jacovi, R., & Piétri, N. 2014a, Icarus, 234, 81 [NASA ADS] [CrossRef] [Google Scholar]
- Couturier-Tamburelli, I., Pietri, N., Crepin, C., et al. 2014b, J. Chem. Phys., 140, 044329 [NASA ADS] [CrossRef] [Google Scholar]
- Cravens, T. E., Robertson, I. P., Ledvina, S. A., et al. 2008, Geophys. Res. Lett., 35, L03103 [NASA ADS] [CrossRef] [Google Scholar]
- Cui, J., Yelle, R. V., Vuitton, V., et al. 2009, Icarus, 200, 581 [NASA ADS] [CrossRef] [Google Scholar]
- de Kok, R. J., Teanby, N. A., Maltagliati, L., Irwin, P. G. J., & Vinatier, S. 2014, Nature, 514, 65 [NASA ADS] [CrossRef] [Google Scholar]
- DelloRusso, N., & Khanna, R. K. 1996, Icarus, 123, 366 [NASA ADS] [CrossRef] [Google Scholar]
- Fischer, G., & Ross, I. G. 2003, J. Phys. Chem. A, 107, 10631 [CrossRef] [Google Scholar]
- Gautier, T., Carrasco, N., Buch, A., et al. 2011, Icarus, 213, 625 [NASA ADS] [CrossRef] [Google Scholar]
- Gautier, T., Carrasco, N., Mahjoub, A., et al. 2012, Icarus, 221, 320 [NASA ADS] [CrossRef] [Google Scholar]
- Gronowski, M., & Kolos, R. 2006, Chem. Phys. Lett., 428, 245 [NASA ADS] [CrossRef] [Google Scholar]
- Gudipati, M. S. 1994, J. Phys. Chem., 98, 9750 [CrossRef] [Google Scholar]
- Gudipati, M. S., Jacovi, R., Couturier-Tamburelli, I., Lignell, A., & Allen, M. 2013, Nature Comm., 4, 1648 [NASA ADS] [CrossRef] [Google Scholar]
- Gudipati, M. S., Daverkausen, J., Maus, M., & Hohlneicher, G. 1994, Chem. Phys., 186, 289 [NASA ADS] [CrossRef] [Google Scholar]
- He, C., & Smith, M. A. 2014, Icarus, 238, 86 [NASA ADS] [CrossRef] [Google Scholar]
- Herzberg, G. 1931, Transactions of the Faraday Society, 27, 0378 [CrossRef] [Google Scholar]
- Imanaka, H., Khare, B. N., Elsila, J. E., et al. 2004, Icarus, 168, 344 [NASA ADS] [CrossRef] [Google Scholar]
- Imanaka, H., Cruikshank, D. P., Khare, B. N., & McKay, C. P. 2012, Icarus, 218, 247 [NASA ADS] [CrossRef] [Google Scholar]
- Kasha, M. 1950, Discussions of the Faraday society, 14 [Google Scholar]
- Khanna, R. K., Pererajarmer, M. A., & Ospina, M. J. 1987, Spectrochimica Acta Part a-Molecular and Biomolecular Spectroscopy, 43, 421 [Google Scholar]
- Khare, B. N., Sagan, C., Arakawa, E. T., et al. 1984, Icarus, 60, 127 [NASA ADS] [CrossRef] [Google Scholar]
- Kim, S. J., Jung, A., Sim, C. K., et al. 2011, Planet. Space Sci., 59, 699 [NASA ADS] [CrossRef] [Google Scholar]
- Klein, A., Kalb, M., & Gudipati, M. S. 1999, J. Phys. Chem. A, 103, 3843 [CrossRef] [Google Scholar]
- Klessinger, M., & Michl, J. 1995, Excited States and Photochemistry of Organic Molecules (New York: VCH), 129 [Google Scholar]
- Lavvas, P. P., Coustenis, A., & Vardavas, I. M. 2008, Planet. Space Sci., 56, 67 [NASA ADS] [CrossRef] [Google Scholar]
- Lellouch, E., Vinatier, S., Moreno, R., et al. 2010, Planet. Space Sci., 58, 1724 [NASA ADS] [CrossRef] [Google Scholar]
- Malsch, K., Hohlneicher, G., Schork, R., & Koppel, H. 2001, Phys. Chem. Chem. Phys., 3, 5393 [CrossRef] [Google Scholar]
- Marcus, R. A. 1965, J. Chem. Phys., 43, 1261 [NASA ADS] [CrossRef] [Google Scholar]
- Minaev, B., Tunell, I., Salek, P., et al. 2004, Mol. Phys., 102, 1391 [NASA ADS] [CrossRef] [Google Scholar]
- Moliner, V., Andres, J., Arnau, A., Silla, E., & Tunon, I. 1996, Chem. Phys., 206, 57 [NASA ADS] [CrossRef] [Google Scholar]
- Moore, M. H., Ferrante, R. F., Moore, W. J., & Hudson, R. 2010, ApJS, 191, 96 [NASA ADS] [CrossRef] [Google Scholar]
- Price, W. C. 1935, Phys. Rev., 47, 444 [NASA ADS] [CrossRef] [Google Scholar]
- Quirico, E., Montagnac, G., Lees, V., et al. 2008, Icarus, 198, 218 [NASA ADS] [CrossRef] [Google Scholar]
- Rannou, P., Cours, T., Le Mouelic, S., et al. 2010, Icarus, 208, 850 [NASA ADS] [CrossRef] [Google Scholar]
- Samuelson, R. E., Mayo, L. A., Knuckles, M. A., & Khanna, R. J. 1997, Planet. Space Sci., 45, 941 [NASA ADS] [CrossRef] [Google Scholar]
- Stiles, P. L., Nauta, K., & Miller, R. E. 2003, Phys. Rev. Lett., 90, 135301 [NASA ADS] [CrossRef] [Google Scholar]
- Teanby, N. A., Irwin, P. G. J., de Kok, R., et al. 2006, Icarus, 181, 243 [NASA ADS] [CrossRef] [Google Scholar]
- Tomasko, M. G., & West, R. A. 2009, Aerosols in Titan’s Atmosphere, Titan from Cassini-Huygens, 297 [Google Scholar]
- Toumi, A., Couturier-Tamburelli, I., Chiavassa, T., & Pietri, N. 2014a, J. Phys. Chem. A, 118, 2453 [CrossRef] [Google Scholar]
- Toumi, A., Piétri, N., Chiavassa, T., & Couturier-Tamburelli, I. 2014b, Icarus, DOI: 10.1016/j.icarus.2014.10.042 [Google Scholar]
- Trolez, Y., & Guillemin, J. C. 2005, Angewandte Chemie-International Edition, 44, 7224 [CrossRef] [Google Scholar]
- Turowski, M., Crepin, C., Gronowski, M., et al. 2010, J. Chem. Phys., 133, 074310 [NASA ADS] [CrossRef] [Google Scholar]
- Turowski, M., Crépin, C., Couturier-Tamburelli, I., Piétri, N., & Kołos, R. 2012, Low Temp. Phys., 38, 723 [NASA ADS] [CrossRef] [Google Scholar]
- Vila, F., Borowski, P., & Jordan, K. D. 2000, J. Phys. Chem. A, 104, 9009 [CrossRef] [Google Scholar]
- Vinatier, S., Bezard, B., Fouchet, T., et al. 2007, Icarus, 188, 120 [NASA ADS] [CrossRef] [Google Scholar]
- Vuitton, V., Yelle, R. V., & McEwan, M. J. 2007, Icarus, 191, 722 [NASA ADS] [CrossRef] [Google Scholar]
All Tables
All Figures
|
Fig. 1 Molecular structures of some acetylenes, cyanoacetylenes, and dicyanoacetylenes, grouped according to their abundance in Titan’s atmosphere (top to bottom). Note that only the cyanoacetylenes have a permanent dipole moment. |
| In the text | |
|
Fig. 2 Temperature dependent infrared spectra (recorded in reflection mode, resulting in twice the path length and twice the absorption or double absorption) taken during warm-up period of HC5N with a ramping rate of 1 K / min, 10 K (bottom), 35 K (middle bottom) after the first phase transition, 120 K (middle top) after the end of the second transition and 300 K (top). |
| In the text | |
|
Fig. 3 Integrated normalized absorbance of HC5N ν2 mode with temperature (β = 1 K min-1) determined by FTIR spectrometry. Insert compares the temperature dependent surface coverage of HC5N with C4N2. |
| In the text | |
|
Fig. 4 Subtraction spectra obtained after 170 min (low), 330 min (middle), and 1275 min (top) of irradiation at λ > 300 nm. Negative absorbance means depletion of the HC5N bands. Positive absorbance is due to the appearance of polymeric material. |
| In the text | |
|
Fig. 5 Residue infrared spectrum obtained after HC5N photolysis experiment (top) and C4N2 photolysis experiment (bottom) at room temperature. Complementarity of the photopolymer functional groups is evident in this figure: HC5N polymer is dominated by NH and CH functional groups because of the presence of hydrogen, whereas the C4N2 polymer is dominated by CC functional groups. Also shown in the figure are the IR spectra of C4N2 polymer made with 266 nm laser irradiation at JPL and the spectra of Titan measured by the Cassini VIMS and CIRS instruments. |
| In the text | |
|
Fig. 6 Polymerization processes proposed for HC5N photochemistry at longer wavelength photons (>300 nm), based on the scheme proposed by Clarke & Ferris (1997) for HC3N polymerization. Based on the infrared spectra, we propose possible structures for HC5N polymers. |
| In the text | |
Current usage metrics show cumulative count of Article Views (full-text article views including HTML views, PDF and ePub downloads, according to the available data) and Abstracts Views on Vision4Press platform.
Data correspond to usage on the plateform after 2015. The current usage metrics is available 48-96 hours after online publication and is updated daily on week days.
Initial download of the metrics may take a while.