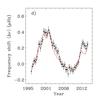
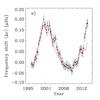
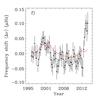
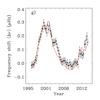
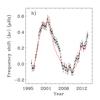
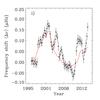
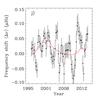
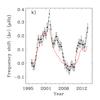
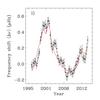
Fig. 4
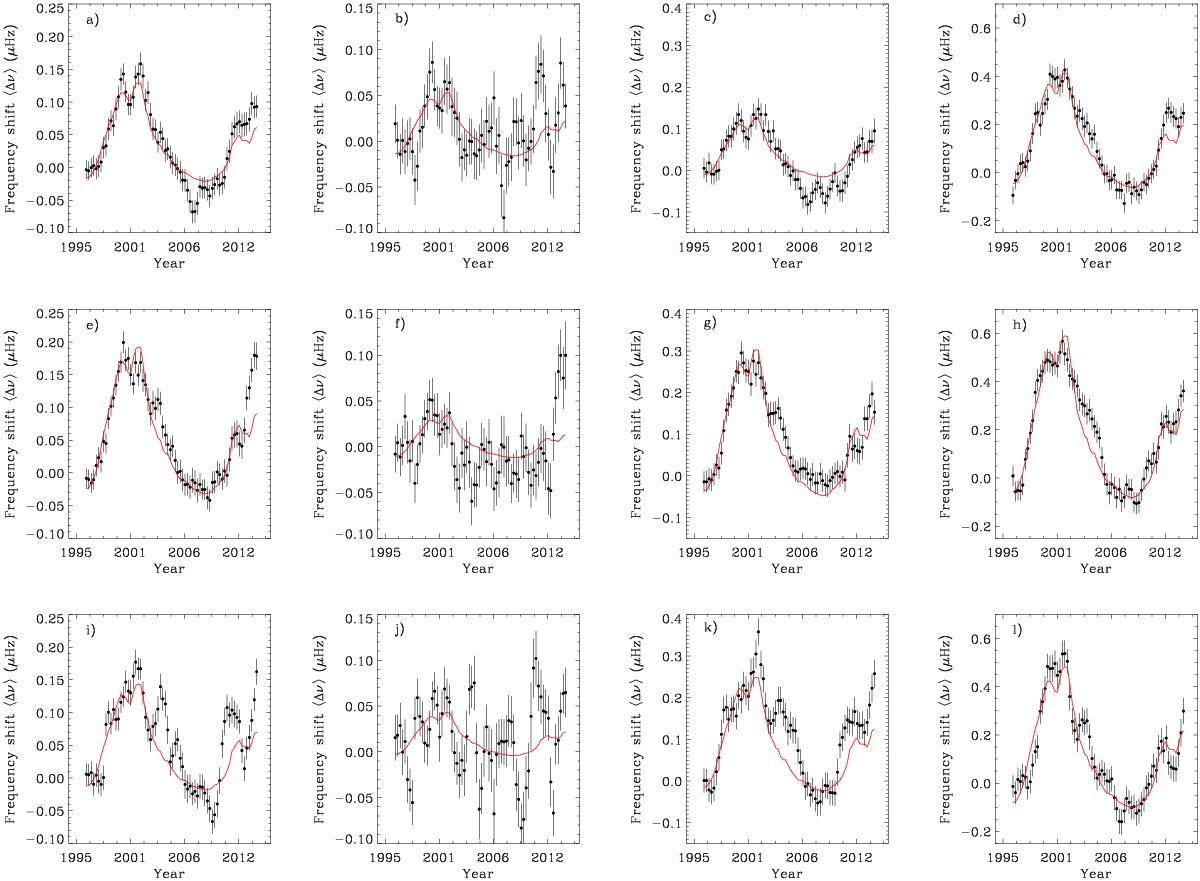
Same as Fig. 1, but for the temporal variations in μHz of the frequency shifts (from top to bottom) ⟨ Δνn,l = 0 ⟩, ⟨ Δνn,l = 1 ⟩, ⟨ Δνn,l = 2 ⟩, at each individual angular degree l = 0, 1, and 2 (black dots). The associated 10.7 cm radio flux, F10.7, scaled to match the rising phase and the maximum of Cycle 23 is shown as a proxy of the solar surface activity (solid line).
Current usage metrics show cumulative count of Article Views (full-text article views including HTML views, PDF and ePub downloads, according to the available data) and Abstracts Views on Vision4Press platform.
Data correspond to usage on the plateform after 2015. The current usage metrics is available 48-96 hours after online publication and is updated daily on week days.
Initial download of the metrics may take a while.