Free Access
Fig. 9
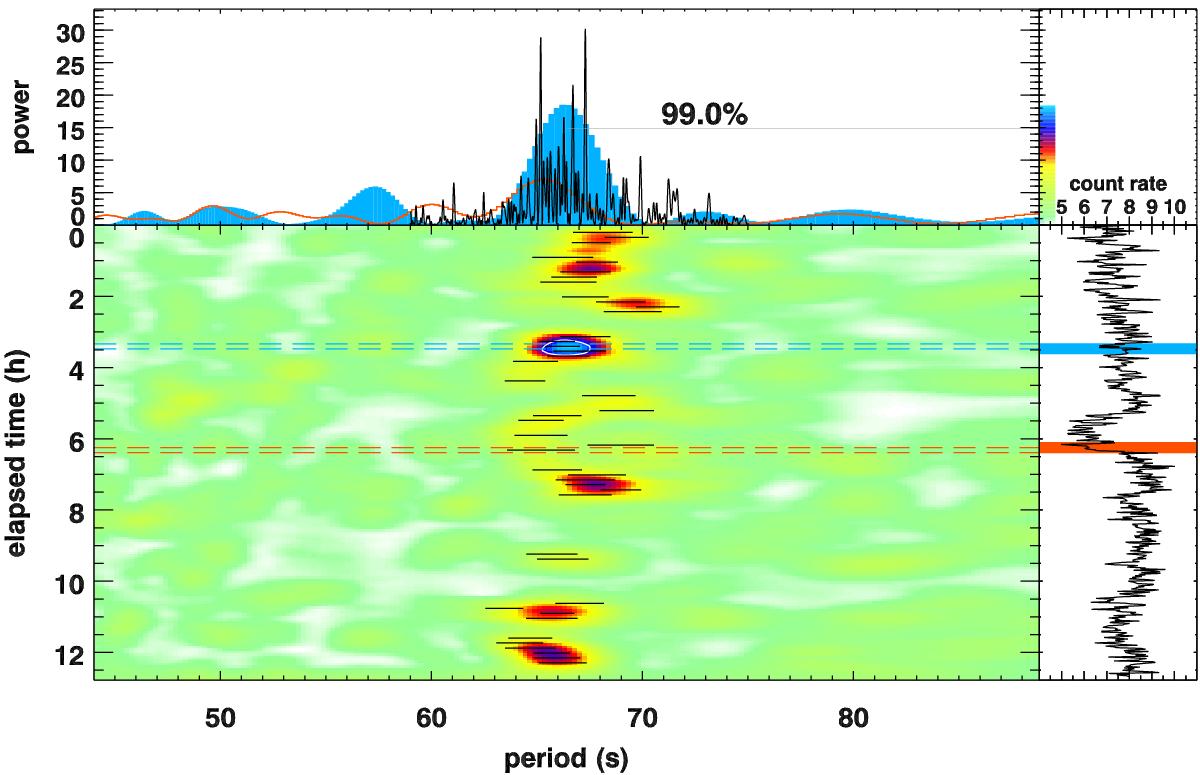
Cal 83 on 2009-05-30.4: time map around the 67 s period in one of 19 XMM-Newton/pn light curves, see description in the right panel of Fig. 1. The time evolution is consistent with that shown in a different format in Fig. 8 in Odendaal et al. (2014).
Current usage metrics show cumulative count of Article Views (full-text article views including HTML views, PDF and ePub downloads, according to the available data) and Abstracts Views on Vision4Press platform.
Data correspond to usage on the plateform after 2015. The current usage metrics is available 48-96 hours after online publication and is updated daily on week days.
Initial download of the metrics may take a while.