Free Access
Fig. 8
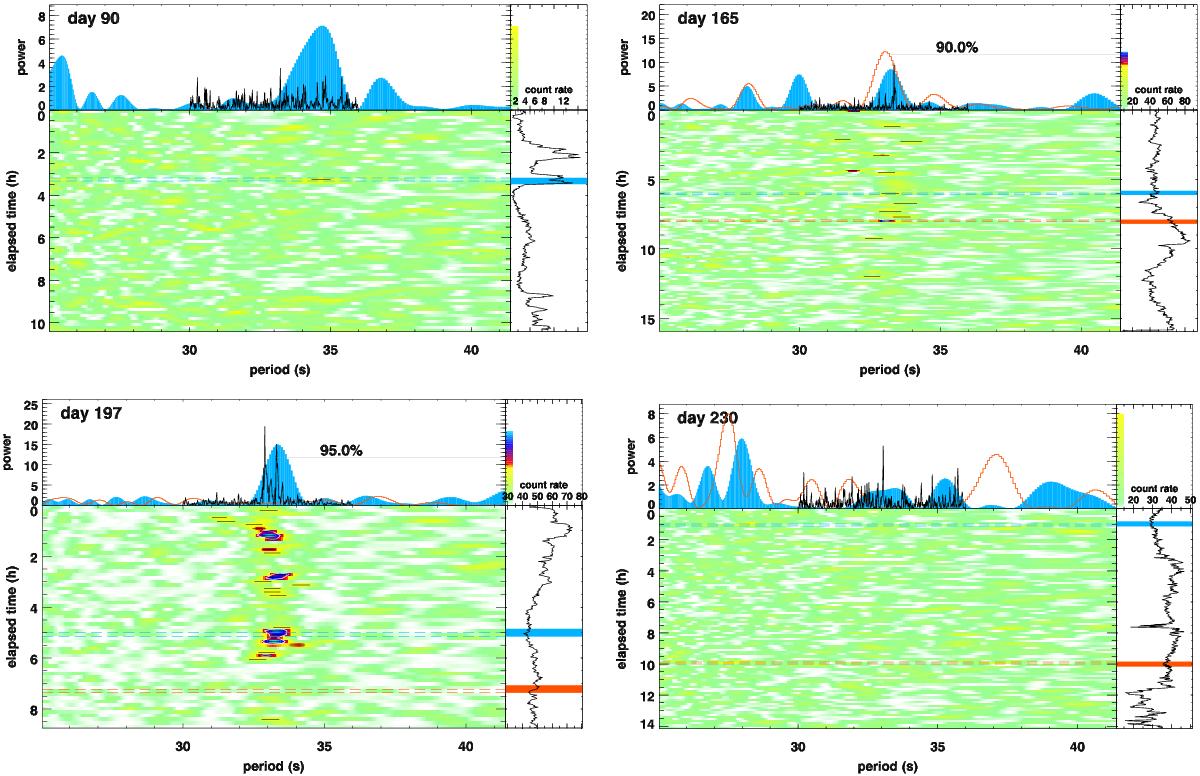
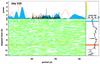
LMC 2009a on days 90, 165, 197, and 230: time maps around the 33 s period in four XMM-Newton/pn light curves, see description in the right panel of Fig. 1. The vertical (time) axes are different in each plot; they only cover the respective exposure times.
This figure is made of several images, please see below:
Current usage metrics show cumulative count of Article Views (full-text article views including HTML views, PDF and ePub downloads, according to the available data) and Abstracts Views on Vision4Press platform.
Data correspond to usage on the plateform after 2015. The current usage metrics is available 48-96 hours after online publication and is updated daily on week days.
Initial download of the metrics may take a while.