Free Access
Fig. 5
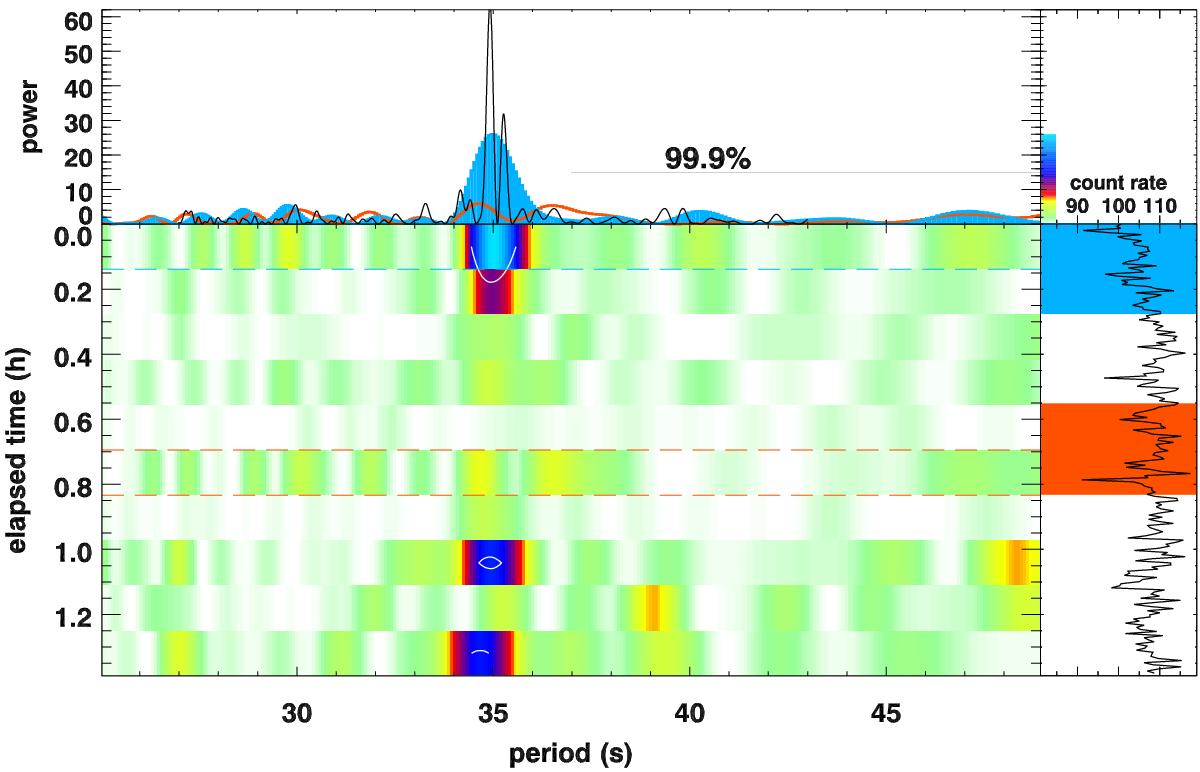
KT Eri on day 159: time map around the 35 s period in the Chandra HRC light curve, see description in the right panel of Fig. 1. The thin solid line in the top panel is the power spectrum from the entire observation and shows two >99.9% significant peaks. This indicates that the period is not constant in time.
Current usage metrics show cumulative count of Article Views (full-text article views including HTML views, PDF and ePub downloads, according to the available data) and Abstracts Views on Vision4Press platform.
Data correspond to usage on the plateform after 2015. The current usage metrics is available 48-96 hours after online publication and is updated daily on week days.
Initial download of the metrics may take a while.