Fig. 3
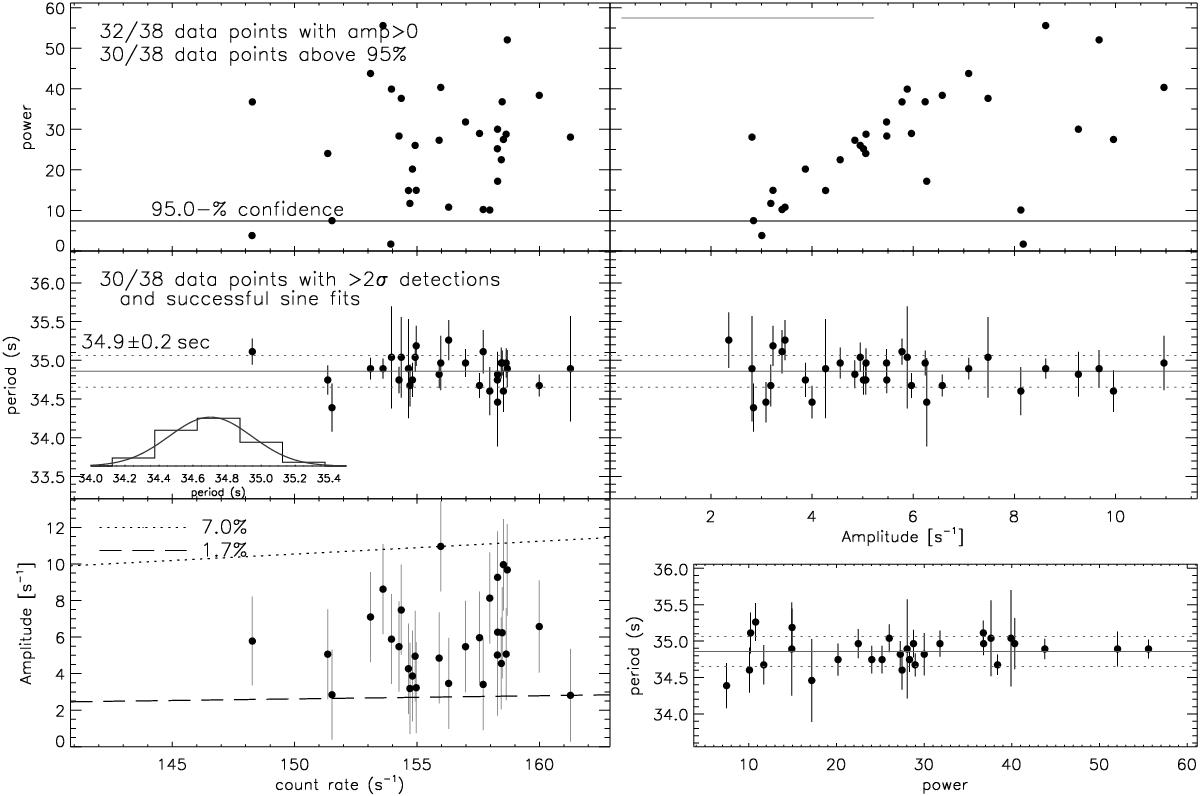
RS Oph on day 54: relations between power (top row) and period (middle row) versus mean RGS2 count rate (left column) and modulation amplitude (right column). The amplitude is mean to peak in units of RGS2 counts per second. A typical uncertainty range in amplitude, derived while fitting sine curves to the phased light curves, is shown with the grey horizontal line in the left corner. The 95% (2σ) detection level (corrected for oversampling) is marked by the horizontal line in the top panels. In the middle panels, the error-weighted median period with standard deviation of the periods is marked with the horizontal solid and dotted lines, respectively. The 95% error bars on periods were calculated with Eq. (4) in Larsson (1996; see text). We show 30 out of 38 data points for which the signal power exceeds a 95% detection and a sine fit yields a positive amplitude. The distribution of periods is shown in the small inset where a Gaussian is added for comparison. Middle right panel: period versus amplitudes are shown, suggesting that larger variations in period occur with smaller amplitudes. Bottom left panel: amplitudes are shown versus count rate, demonstrating that there is no correlation. Ranges of amplitudes relative to count rate are marked by the dashed and dotted lines. Bottom right panel: periods versus power are shown, which also seem to show that larger variations in period occur at lower values of power.
Current usage metrics show cumulative count of Article Views (full-text article views including HTML views, PDF and ePub downloads, according to the available data) and Abstracts Views on Vision4Press platform.
Data correspond to usage on the plateform after 2015. The current usage metrics is available 48-96 hours after online publication and is updated daily on week days.
Initial download of the metrics may take a while.