Fig. 2
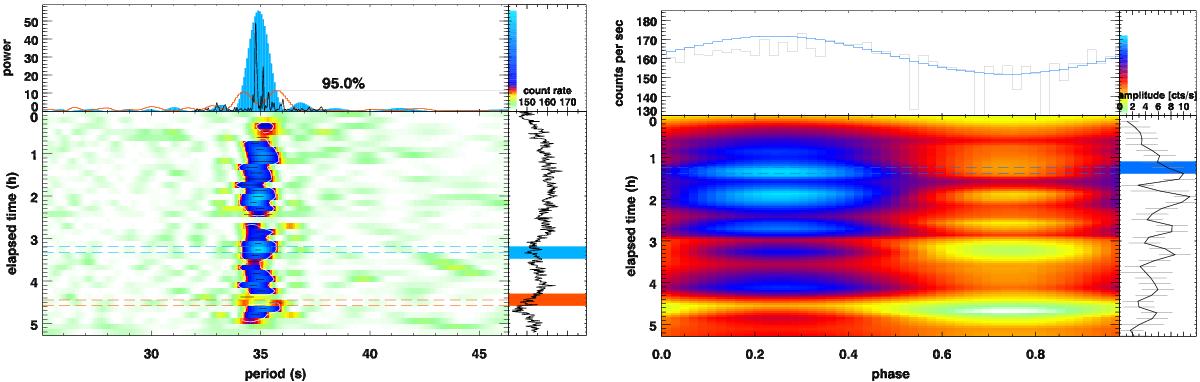
RS Oph on day 54. Left: time map of the 35 s period in the XMM-Newton RGS2 light curve, see description of right panel in Fig. 1. Right: time map of folded light curves, where each curve was artificially moved in phase for the peak to occur at phase 0.25. In the top panel, an example is shown with the sine curve fit from which the modulation amplitudes with uncertainties were determined. In the right panel, the evolution of amplitudes is shown.
Current usage metrics show cumulative count of Article Views (full-text article views including HTML views, PDF and ePub downloads, according to the available data) and Abstracts Views on Vision4Press platform.
Data correspond to usage on the plateform after 2015. The current usage metrics is available 48-96 hours after online publication and is updated daily on week days.
Initial download of the metrics may take a while.