Fig. A.2
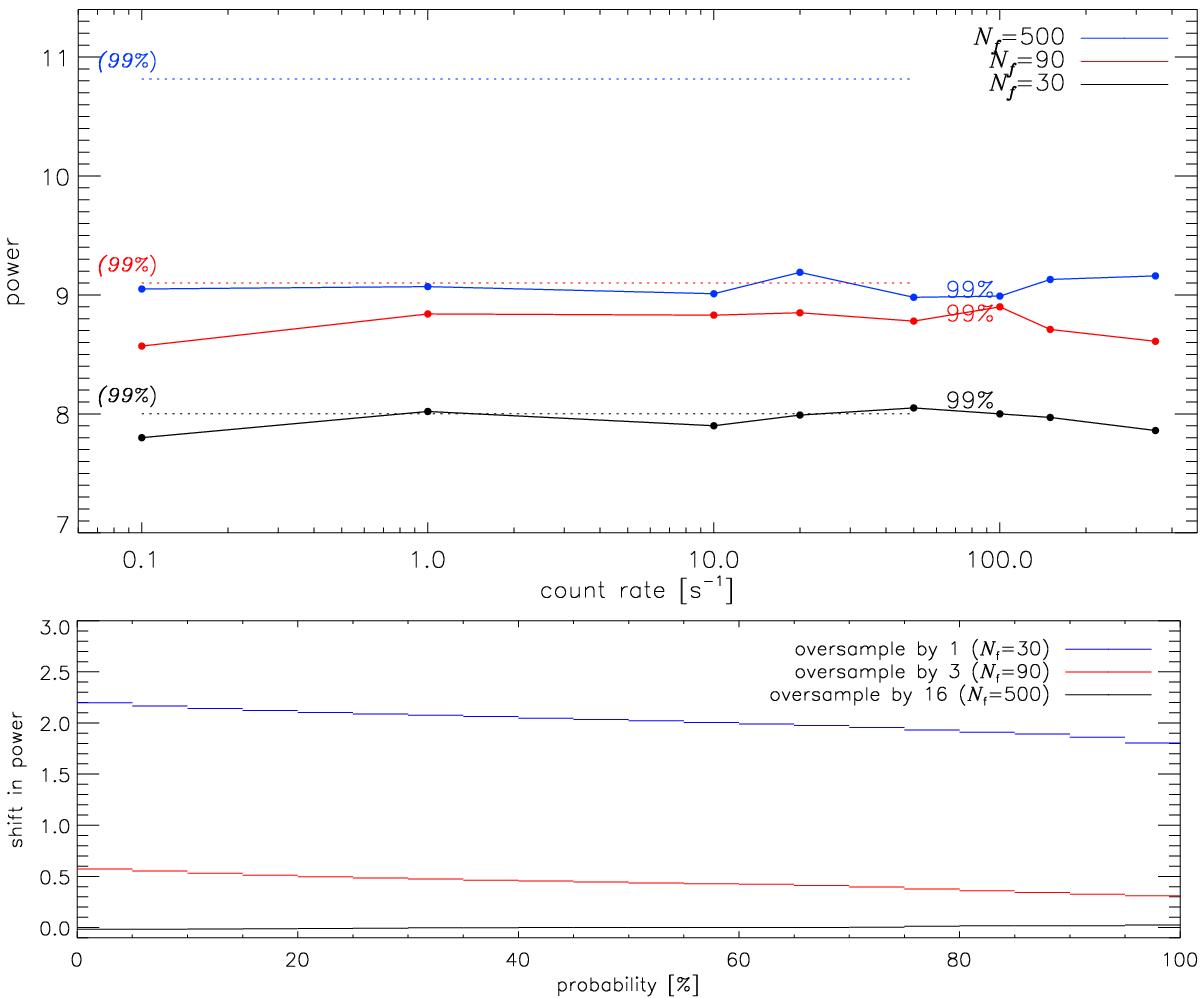
Top: comparison of 99% detection thresholds obtained with simulations as in Fig. A.1 using different oversampling factors 16 (Nf = 500), 3 (Nf = 90), and 1 (Nf = 30) with the number of tested frequencies Nf given in the legend. The dotted lines are the thresholds obtained from Eq. (A.2), and they agree best with the simulation results without oversampling, while for higher oversampling rates, the required power for a 99% detection is much lower. Bottom: shift in power as a function of detection probability, illustrating that it is not constant. When determining detection probabilities, we correct for oversampling by interpolating these simulations.
Current usage metrics show cumulative count of Article Views (full-text article views including HTML views, PDF and ePub downloads, according to the available data) and Abstracts Views on Vision4Press platform.
Data correspond to usage on the plateform after 2015. The current usage metrics is available 48-96 hours after online publication and is updated daily on week days.
Initial download of the metrics may take a while.