Fig. A.1
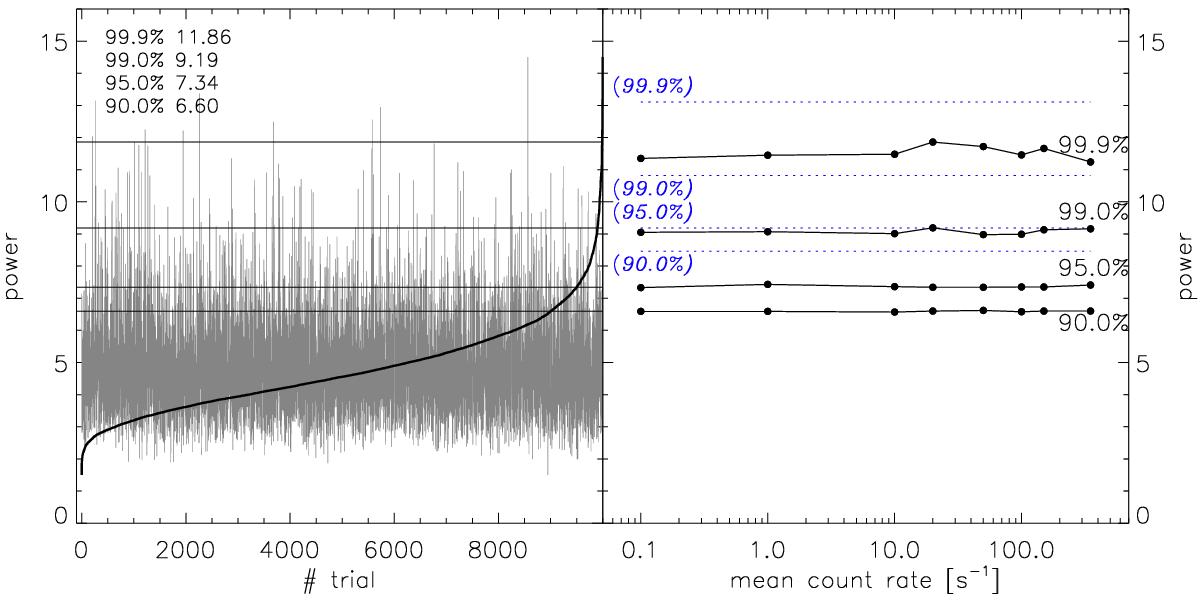
Simulations based on N = 10 000 synthetic light curves of 1000 s duration with Poisson noise around various given mean count rates to estimate the likelihood of random detections at four levels of confidence. Power spectra of the random light curves were calculated over the period range 25−100 s, testing 500 frequencies. Left panel: Example of 20 counts per second as mean count rate. We show the maximum powers in the order of trial number in grey and sorted by power value with the thick black line. The sorted curve was used to extract the power thresholds given in the legend. Right panel: results for the four confidence levels as a function of mean count rate with connected black bullet points in comparison to the theoretical thresholds according to Eq. (A.2), with Nf = 500, included with the dotted blue lines.
Current usage metrics show cumulative count of Article Views (full-text article views including HTML views, PDF and ePub downloads, according to the available data) and Abstracts Views on Vision4Press platform.
Data correspond to usage on the plateform after 2015. The current usage metrics is available 48-96 hours after online publication and is updated daily on week days.
Initial download of the metrics may take a while.