Fig. 11
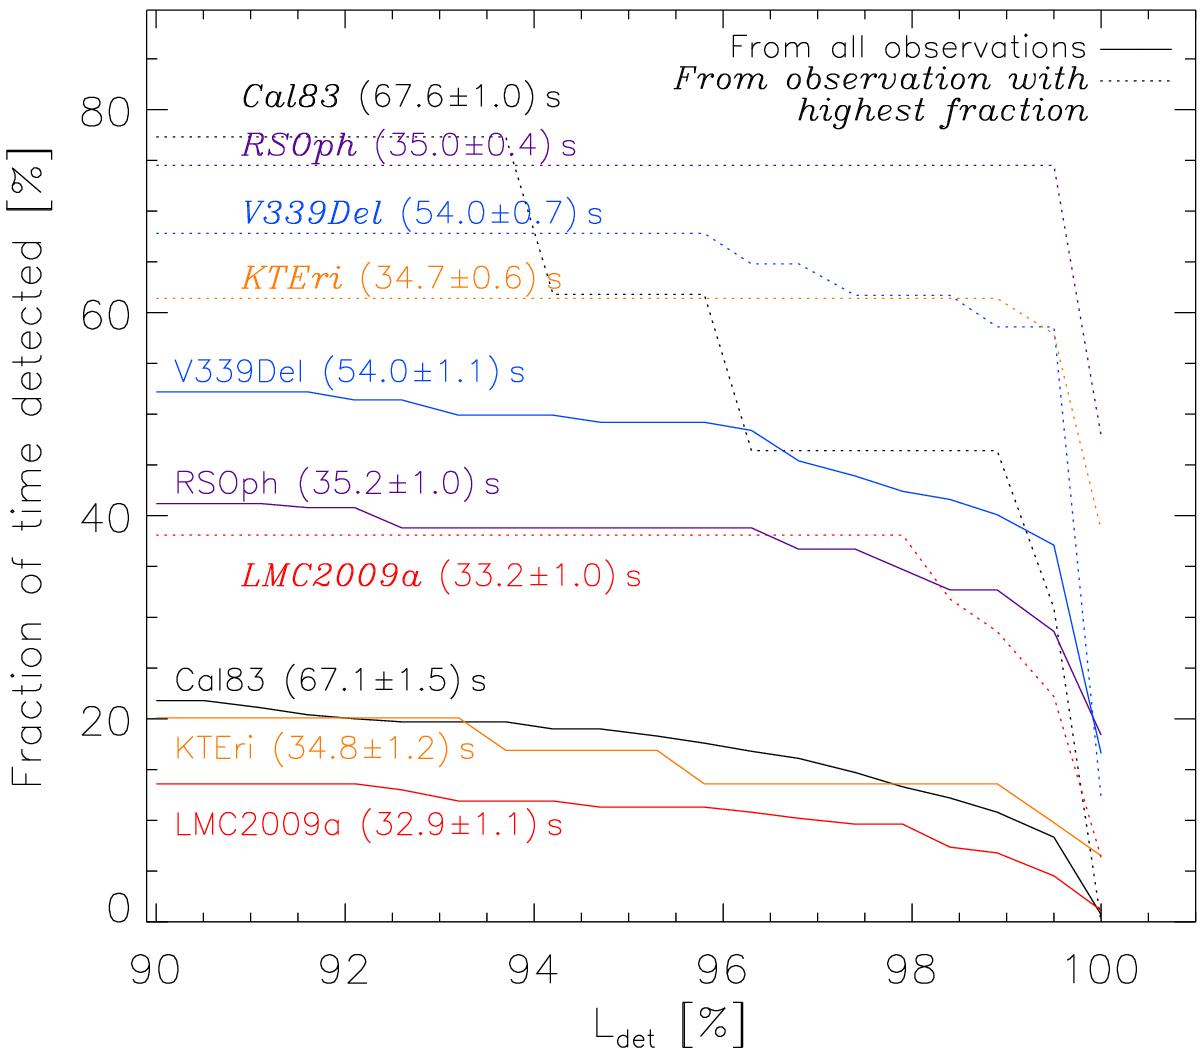
Fractions of observing time for which the strongest periods are detectable as a function of detection threshold. The solid lines are the average fractions of time derived from all available observations, while the dotted lines (with labels in italics) are the fractions of time derived from the single observation in which the period is seen most frequently. For this plot, power spectra from directly adjacent, non-overlapping time intervals have been used. For no system, the period was detected 100% of the time, showing the transient nature. Furthermore, the signal is episodic because the fractions are not the same in all observations.
Current usage metrics show cumulative count of Article Views (full-text article views including HTML views, PDF and ePub downloads, according to the available data) and Abstracts Views on Vision4Press platform.
Data correspond to usage on the plateform after 2015. The current usage metrics is available 48-96 hours after online publication and is updated daily on week days.
Initial download of the metrics may take a while.