Fig. 10
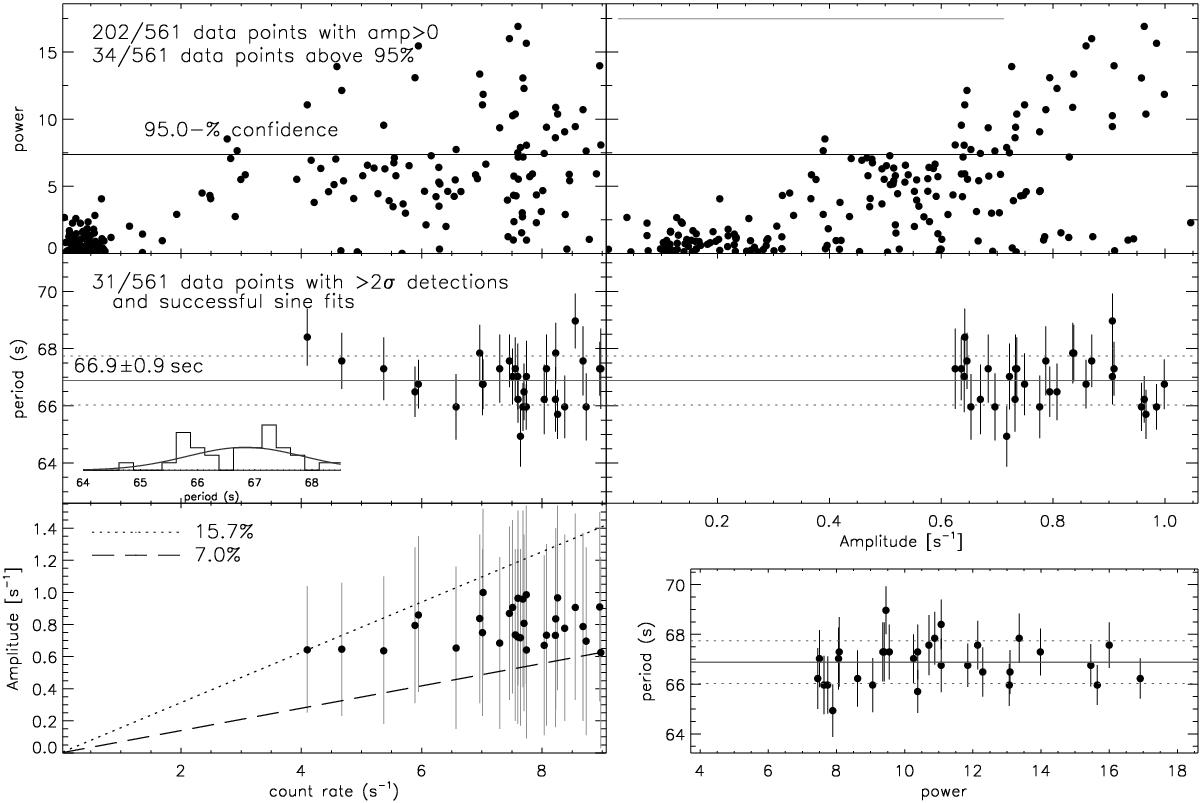
Same as Fig. 3, with data collected from 20 observations of Cal 83, divided into a total of 578 1000 s time segments. 17 of these intervals yield zero count rate and were excluded. Furthermore, all data points yielding only upper limits in amplitude were excluded, which left 202 data points, of which 34 time intervals yield a >95% detection of a periodic signal. The expected correlation between modulation amplitude and signal power (top right) is contaminated by a large number of overestimated amplitudes that are most likely caused by additional, non-periodic variability. These deviations are consistent with the large uncertainties in amplitude. The 95% threshold is corrected for oversampling, but not for multiple testing. 31 of 34 data points that are found above this threshold and yield a successful sine fit are used in the lower two rows. The variations in period of about ±3 s reported by Odendaal et al. (2014) can be recognised in the middle row and bottom right, but do not seem to correlate with count rate, amplitude, or signal power.
Current usage metrics show cumulative count of Article Views (full-text article views including HTML views, PDF and ePub downloads, according to the available data) and Abstracts Views on Vision4Press platform.
Data correspond to usage on the plateform after 2015. The current usage metrics is available 48-96 hours after online publication and is updated daily on week days.
Initial download of the metrics may take a while.