Fig. 1
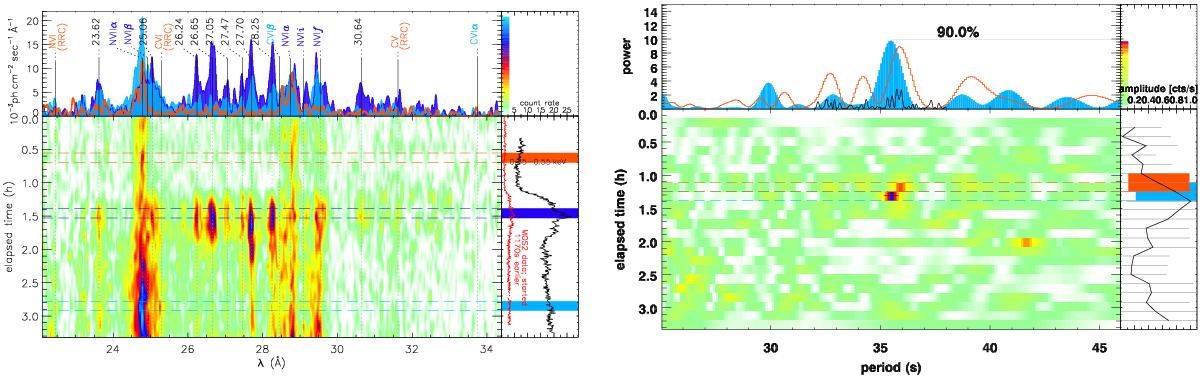
RS Oph on day 26.1: spectral (left) and period (right) time-maps on the same time scales in vertical direction. Left: spectral time-map showing the evolution of the RGS spectrum; taken from Ness et al. (2013a), adding unidentified emission features with their wavelengths in Å. The simultaneous EPIC/pn and MOS2 light curves are shown in the right panel, rotated clockwise by 90°. The pn has a longer initial overhead such that the exposure started ~1170 s later than the RGS and the MOS exposures, thus the black curve (pn) starts at 0.33 h, while the red curve (MOS) starts at 0 h. Right: dynamic power spectrum consisting of the power spectra computed from 24 overlapping 1000 s time segments from the pn light curve. To map them into the 11 ks time frame of the observation, the width of each row in the central panel is reduced to 500 s. The horizontal orange/blue dashed lines running across the main panel border two adjacent 500 s time intervals that correspond to the (wider) coloured bars in the right panel. They mark the overlapping 1000 s time intervals from which the individual power spectra were computed that are shown with the same colours in the top panel. The colour scheme for the main panel is decoded in the top right part; blue colours were chosen to mark periods with >90% confidence and red for 30−80%, while yellow/light green reflect noise. Colour-coding and thresholds have been corrected for oversampling and multiple testing (see text). The short horizontal black line in the main panel at 35 s represents the 90% uncertainty range in period of a significant (> 2σ) signal. In the top panel, in addition to the two power spectra from partial light-curves, the power spectrum from the full light-curve is shown in black; the same oversampling factor of 16.67 has been applied and contains no significant signal. The widths of the peaks in the respective power spectra are consistent with the intrinsic period resolution imposed by windowing. At the right, we show the evolution of the modulation amplitude, most of them are upper limits.
Current usage metrics show cumulative count of Article Views (full-text article views including HTML views, PDF and ePub downloads, according to the available data) and Abstracts Views on Vision4Press platform.
Data correspond to usage on the plateform after 2015. The current usage metrics is available 48-96 hours after online publication and is updated daily on week days.
Initial download of the metrics may take a while.