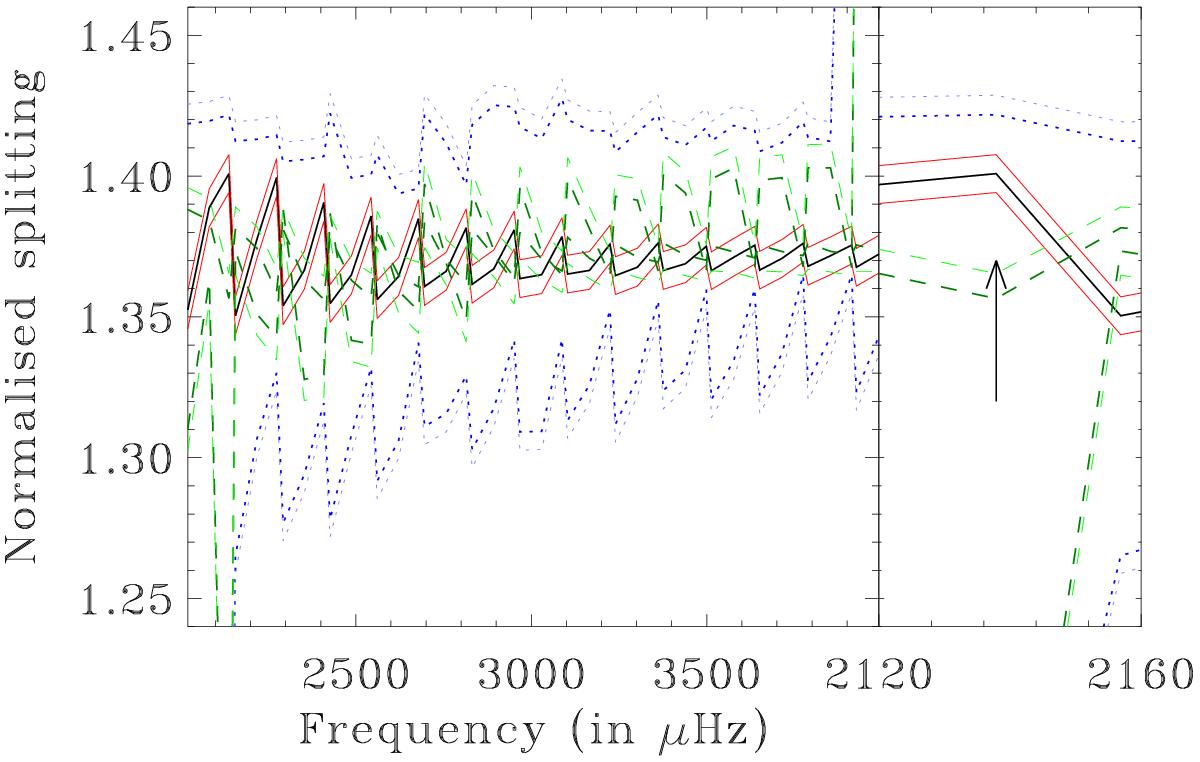
Fig. 8

Rotational splittings and 1σ error bars (solid red lines), constraints deduced from inequalities on pairs of modes (dotted blue lines), and constraints from multiple modes using simplex method (dashed green lines). The lighter lines denote the 1σ error bars. Right panel: zoom on ℓ = 3 mode where an inequality breaks down by 4.99σ (as indicated by the arrow). (Colour online.)
Current usage metrics show cumulative count of Article Views (full-text article views including HTML views, PDF and ePub downloads, according to the available data) and Abstracts Views on Vision4Press platform.
Data correspond to usage on the plateform after 2015. The current usage metrics is available 48-96 hours after online publication and is updated daily on week days.
Initial download of the metrics may take a while.


