Free Access
Fig. 2
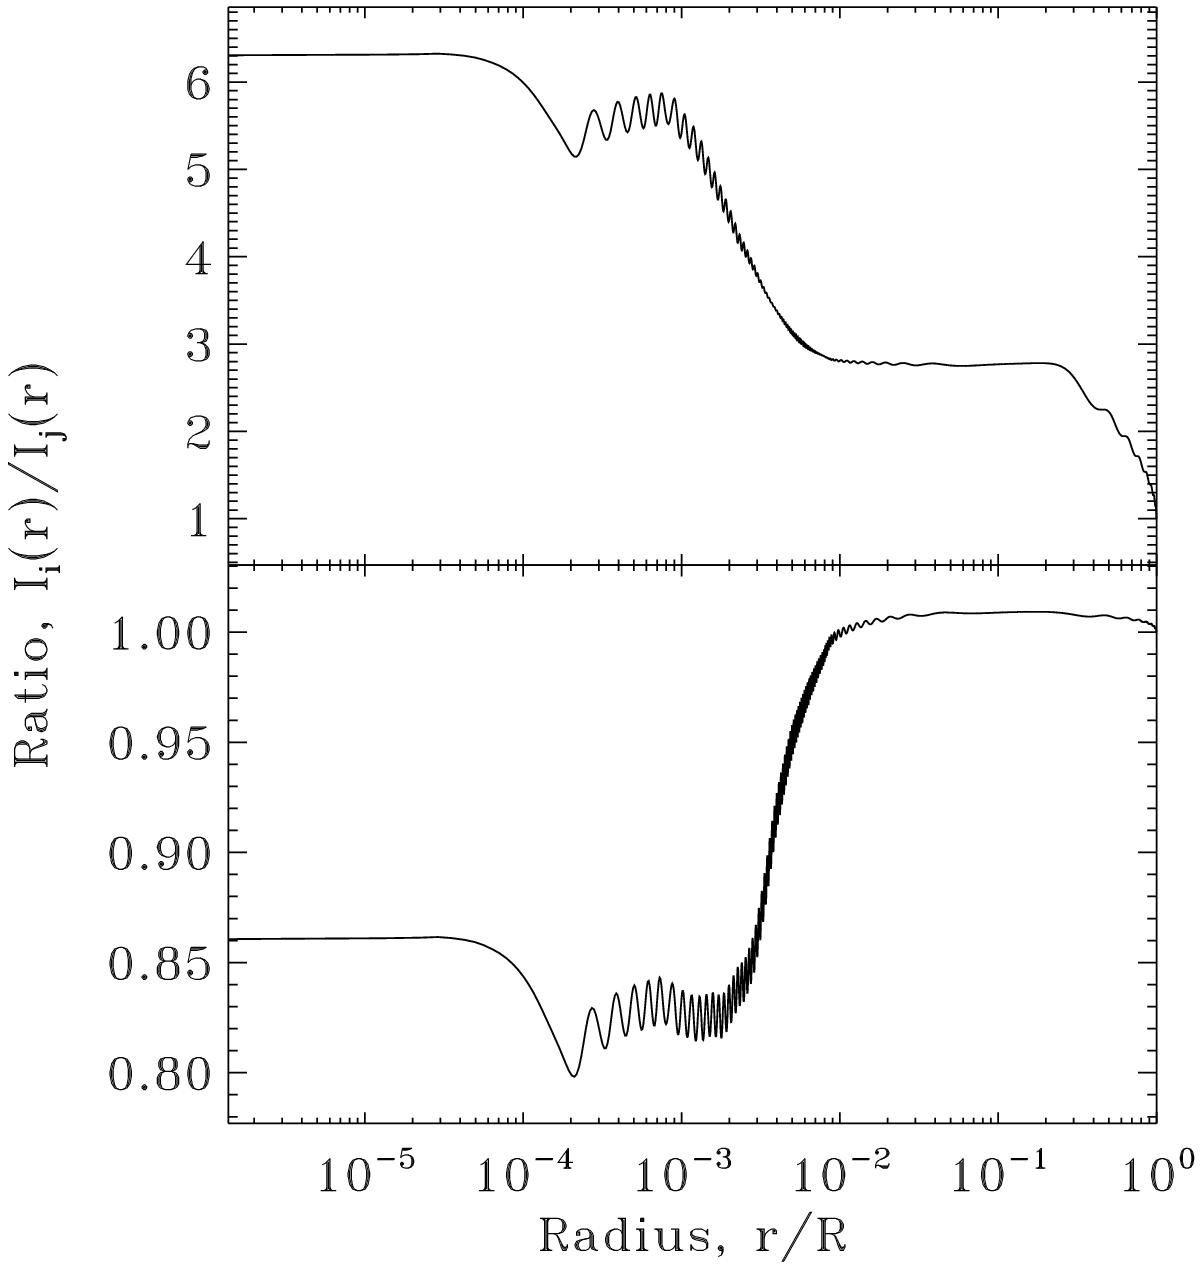
Ratios of integrated kernels for dipole modes. The top panel shows the ratio between the integrated kernels of a g-like mode and a p-like mode, whereas the bottom panel is for two g-like modes. As can be seen in the lower panel, the ratio crosses the value 1, which means that the two integrated kernels have crossed.
Current usage metrics show cumulative count of Article Views (full-text article views including HTML views, PDF and ePub downloads, according to the available data) and Abstracts Views on Vision4Press platform.
Data correspond to usage on the plateform after 2015. The current usage metrics is available 48-96 hours after online publication and is updated daily on week days.
Initial download of the metrics may take a while.