Fig. 19
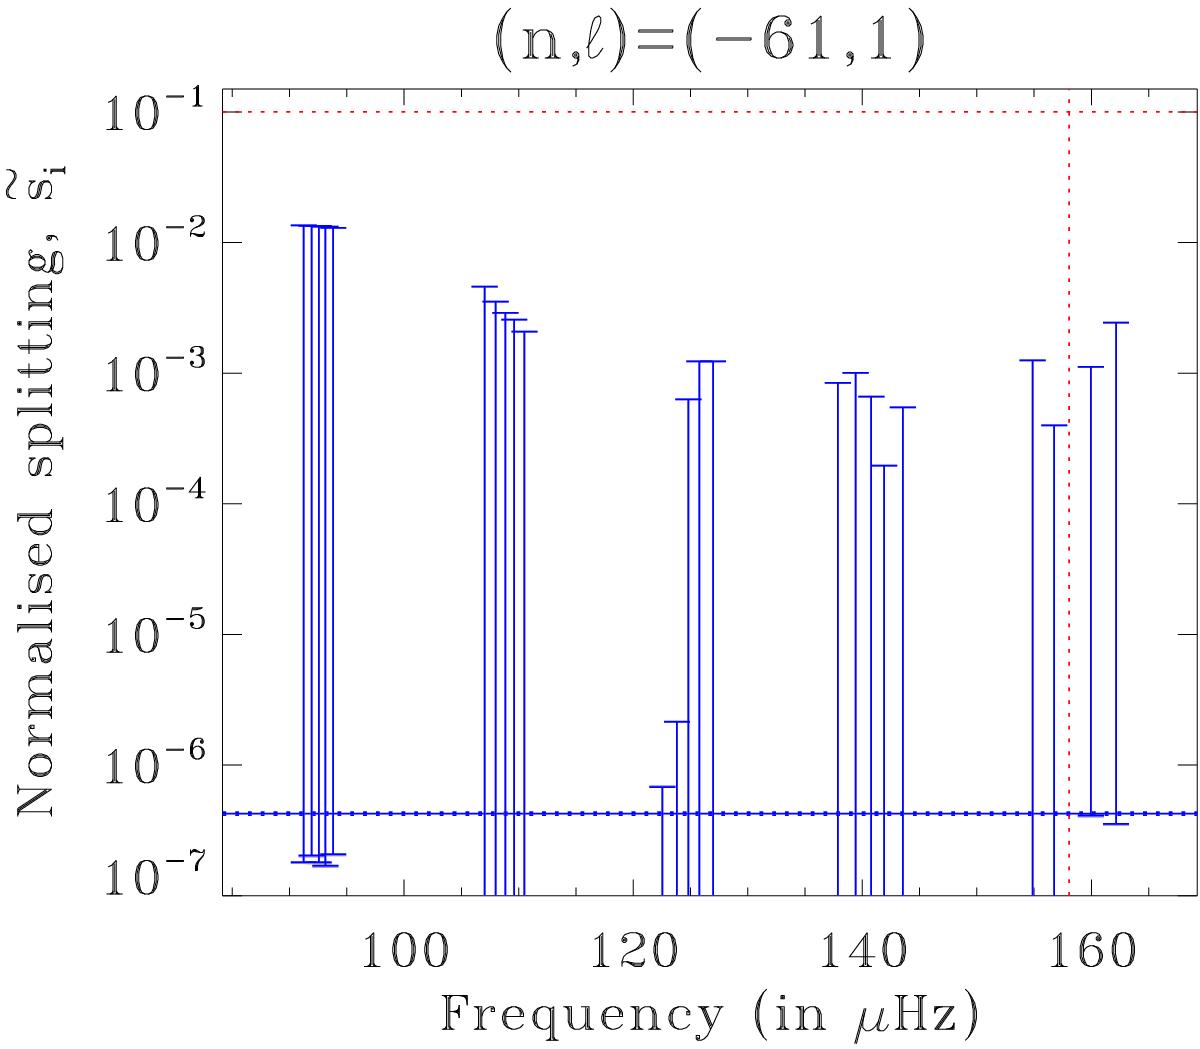
Same as Fig. 17 but using the inequalities based on Rayleigh’s criterion. The centre has also been excluded, as described in the text, thereby leading to more stringent conditions. The horizontal red dotted line near the top of the figure is an upper limit deduced from the surface rotation rate. The error bars which extend off the bottom of the plot go to negative values. (Colour online.)
Current usage metrics show cumulative count of Article Views (full-text article views including HTML views, PDF and ePub downloads, according to the available data) and Abstracts Views on Vision4Press platform.
Data correspond to usage on the plateform after 2015. The current usage metrics is available 48-96 hours after online publication and is updated daily on week days.
Initial download of the metrics may take a while.