Fig. 17
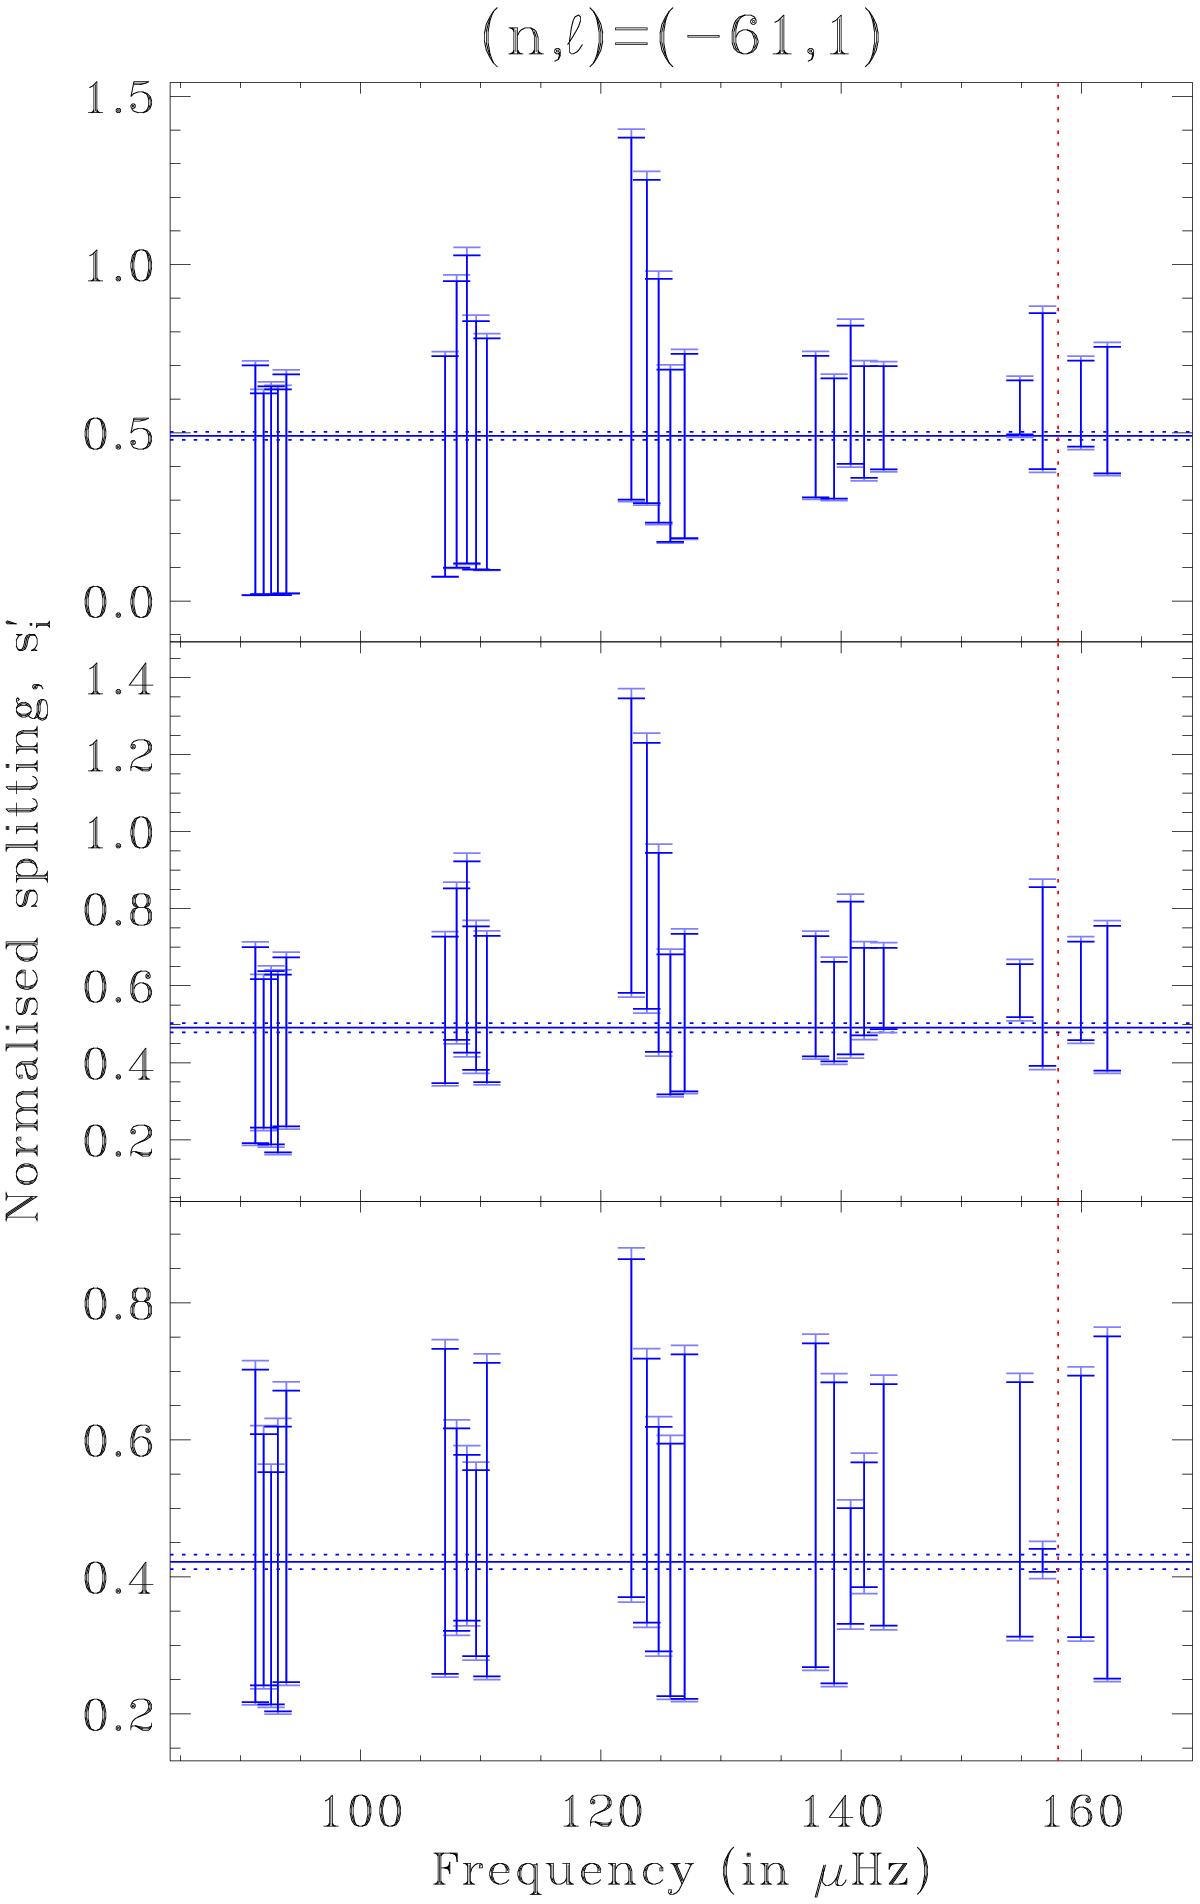
Upper and lower bounds on a given splitting, deduced from the N − 1 other rotational splittings, assuming that the rotation profile decreases. In the upper and middle panels, Model 1 has been used as the reference model, whereas in the lower panel, Model 2 is the reference model. In the lower two panels, a more restrictive set of inequalities is obtained by excluding the centre, as described in Sect. 2.1.2. The frequency of the original mode is shown by the red vertical dotted line, whereas the blue horizontal dotted and solid lines indicate its rotational splitting plus or minus the error bar. The dark blue solid vertical segments indicate the upper and lower bounds deduced from the other modes, and the 1σ error bars are indicated by the light blue extensions. (Colour online.)
Current usage metrics show cumulative count of Article Views (full-text article views including HTML views, PDF and ePub downloads, according to the available data) and Abstracts Views on Vision4Press platform.
Data correspond to usage on the plateform after 2015. The current usage metrics is available 48-96 hours after online publication and is updated daily on week days.
Initial download of the metrics may take a while.