Fig. 11
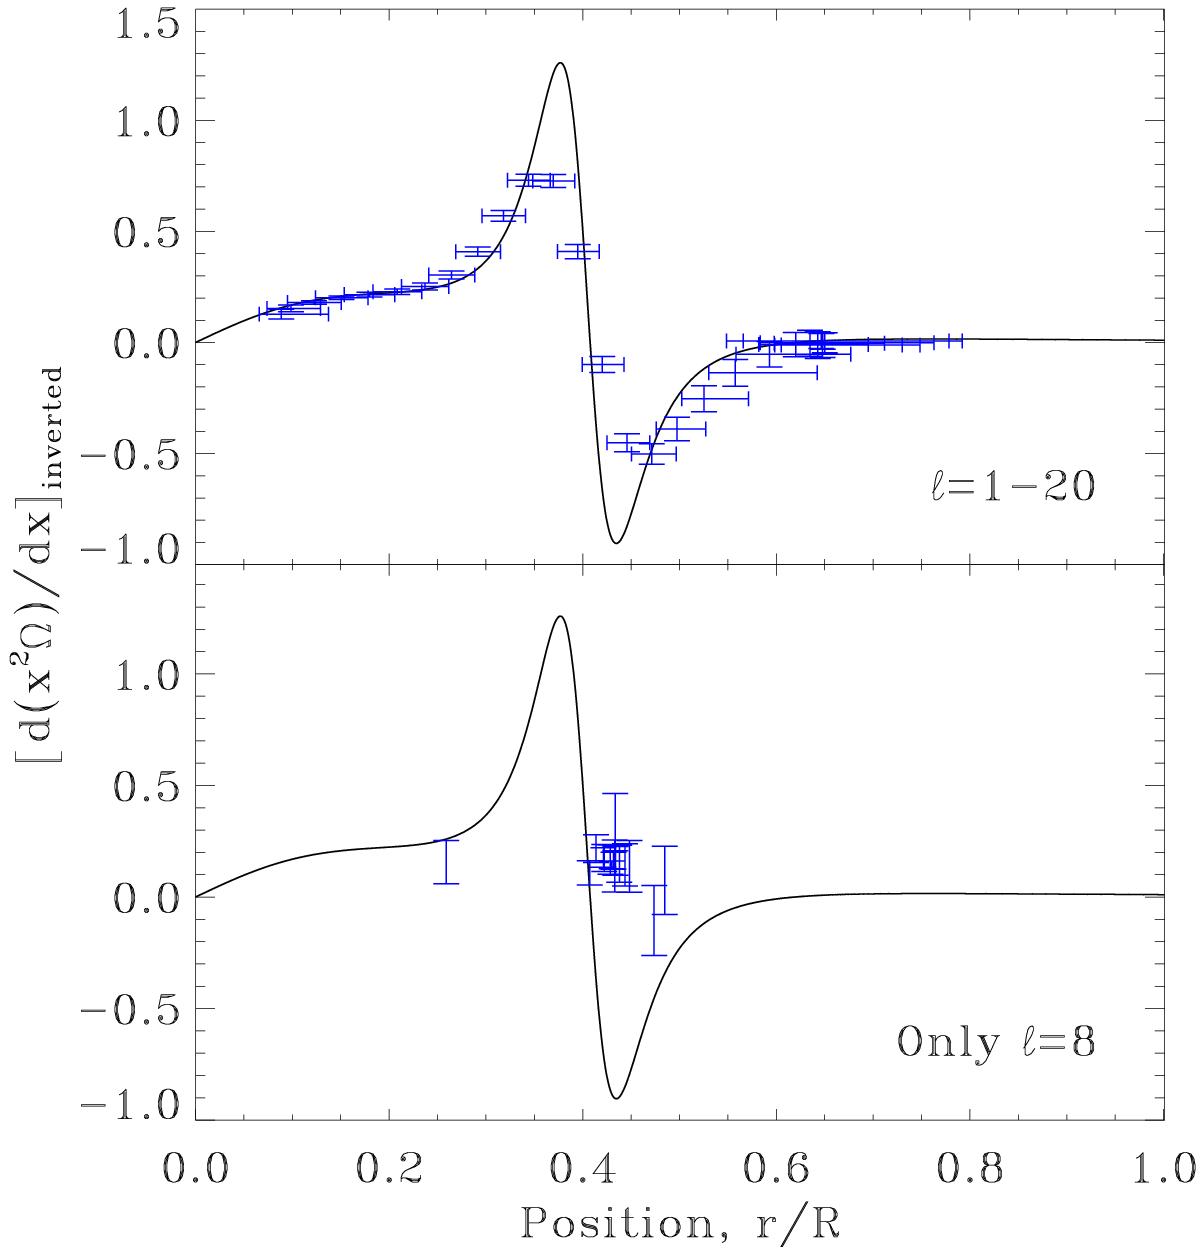
Inverted profile for the gradient of the angular momentum, using ℓ = 1 to 20 modes (upper panel) and only ℓ = 8 modes (lower panel). The continuous line shows the actual gradient, whereas the blue crosses indicate inversion results and associated 1σ error bars. For the sake of clarity, the horizontal error bars (obtained from the averaging kernels) have been omitted in the lower panel. (Colour online.)
Current usage metrics show cumulative count of Article Views (full-text article views including HTML views, PDF and ePub downloads, according to the available data) and Abstracts Views on Vision4Press platform.
Data correspond to usage on the plateform after 2015. The current usage metrics is available 48-96 hours after online publication and is updated daily on week days.
Initial download of the metrics may take a while.