Free Access
Fig. 6
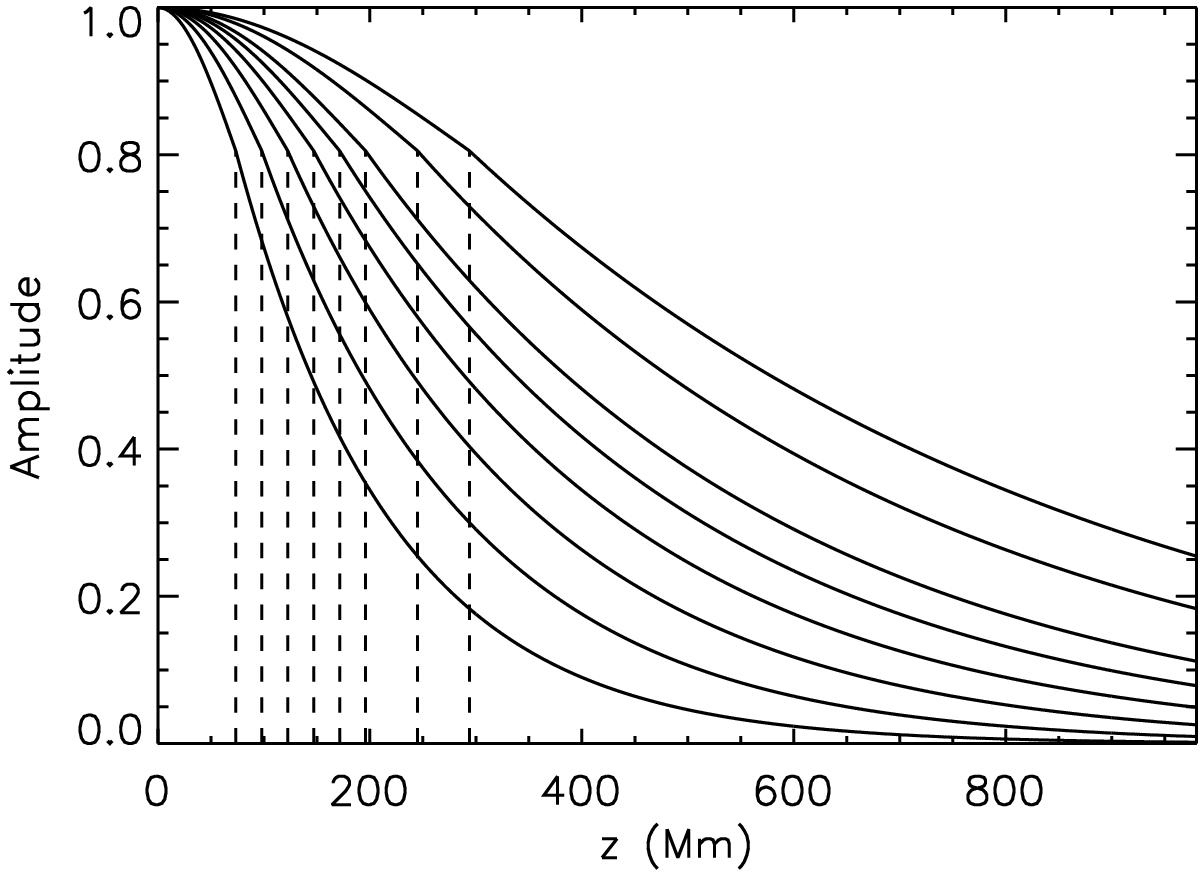
Damping envelopes (Eq. (5)) for each of the eight components of the broadband signal. The lower curve corresponds to the shortest period of 30 s while the upper curve corresponds to the longest period of 120 s. The dashed lines indicate the locations of the switch from Gaussian to exponential damping profiles.
Current usage metrics show cumulative count of Article Views (full-text article views including HTML views, PDF and ePub downloads, according to the available data) and Abstracts Views on Vision4Press platform.
Data correspond to usage on the plateform after 2015. The current usage metrics is available 48-96 hours after online publication and is updated daily on week days.
Initial download of the metrics may take a while.