Free Access
Fig. 3
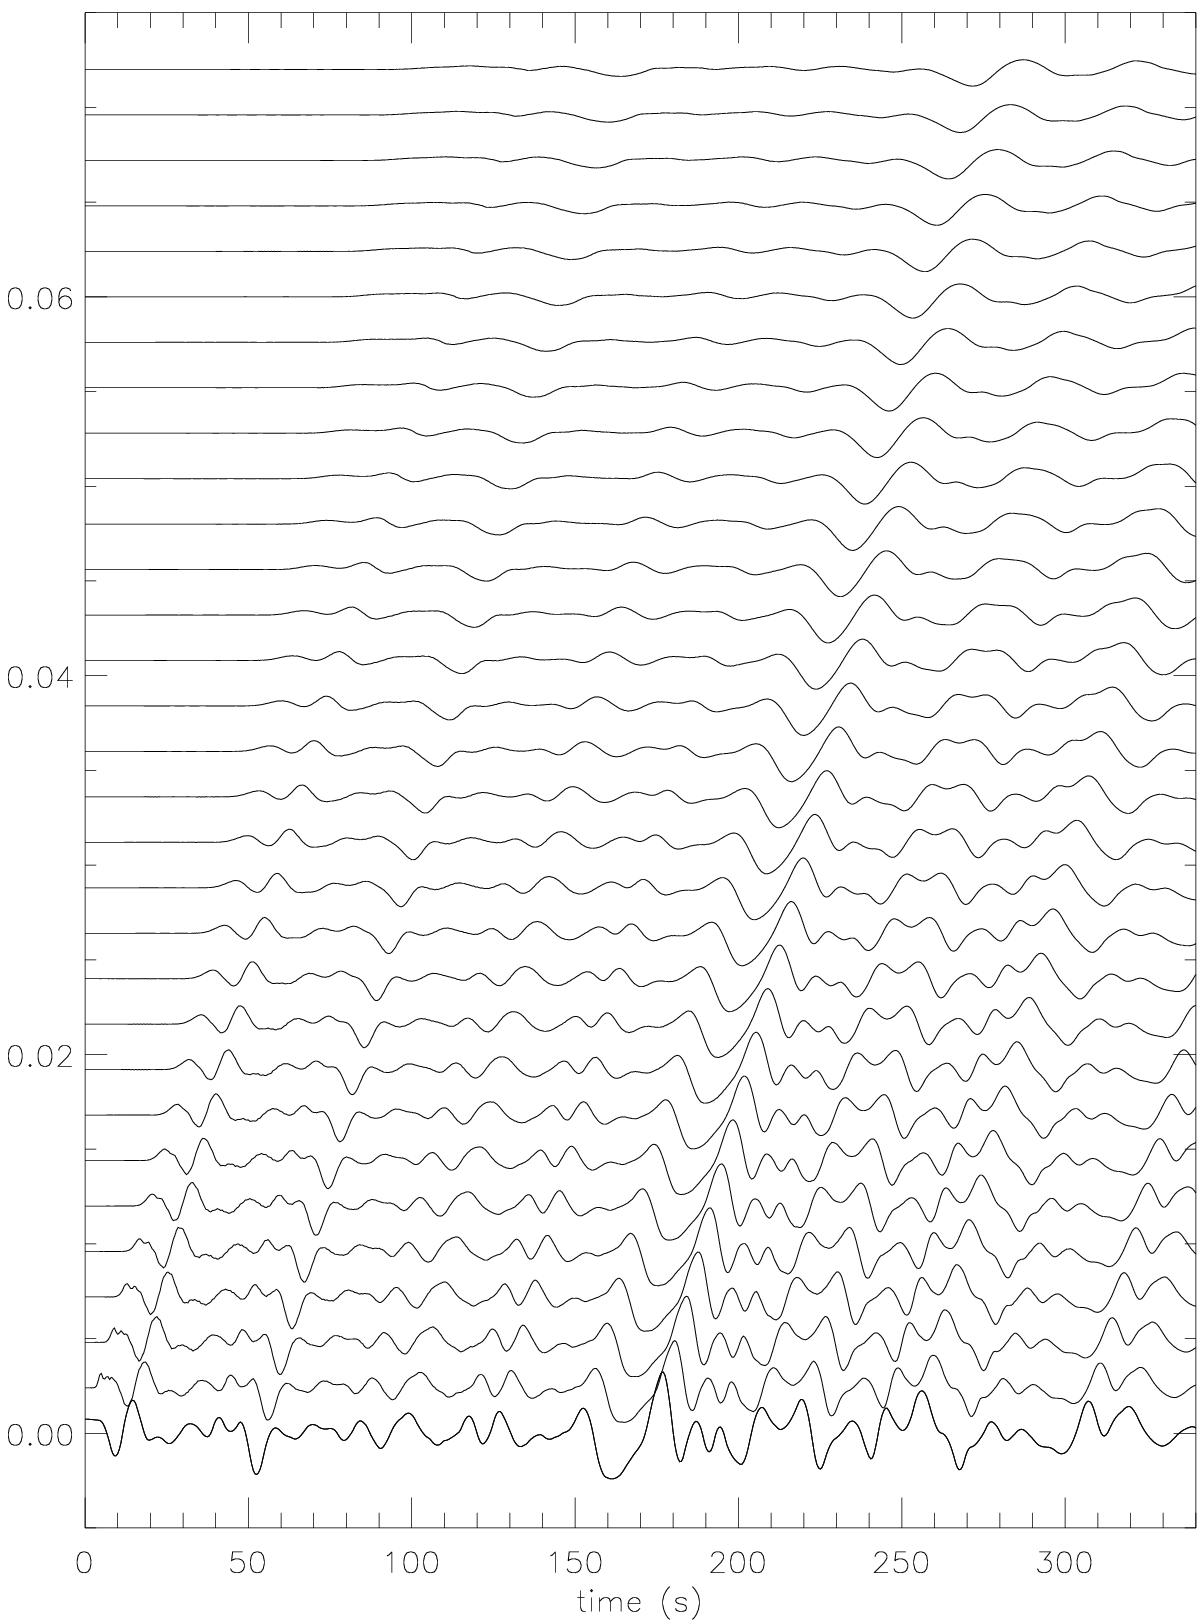
Transverse velocity signal vx at the loop axis (x = y = 0) as a function of time. The signals at different heights are stacked along the y-axis by adding an appropriate constant. The lowest and highest signals correspond to heights of 0 and 86 Mm, respectively.
Current usage metrics show cumulative count of Article Views (full-text article views including HTML views, PDF and ePub downloads, according to the available data) and Abstracts Views on Vision4Press platform.
Data correspond to usage on the plateform after 2015. The current usage metrics is available 48-96 hours after online publication and is updated daily on week days.
Initial download of the metrics may take a while.