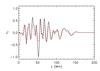
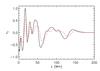
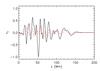
Fig. 18
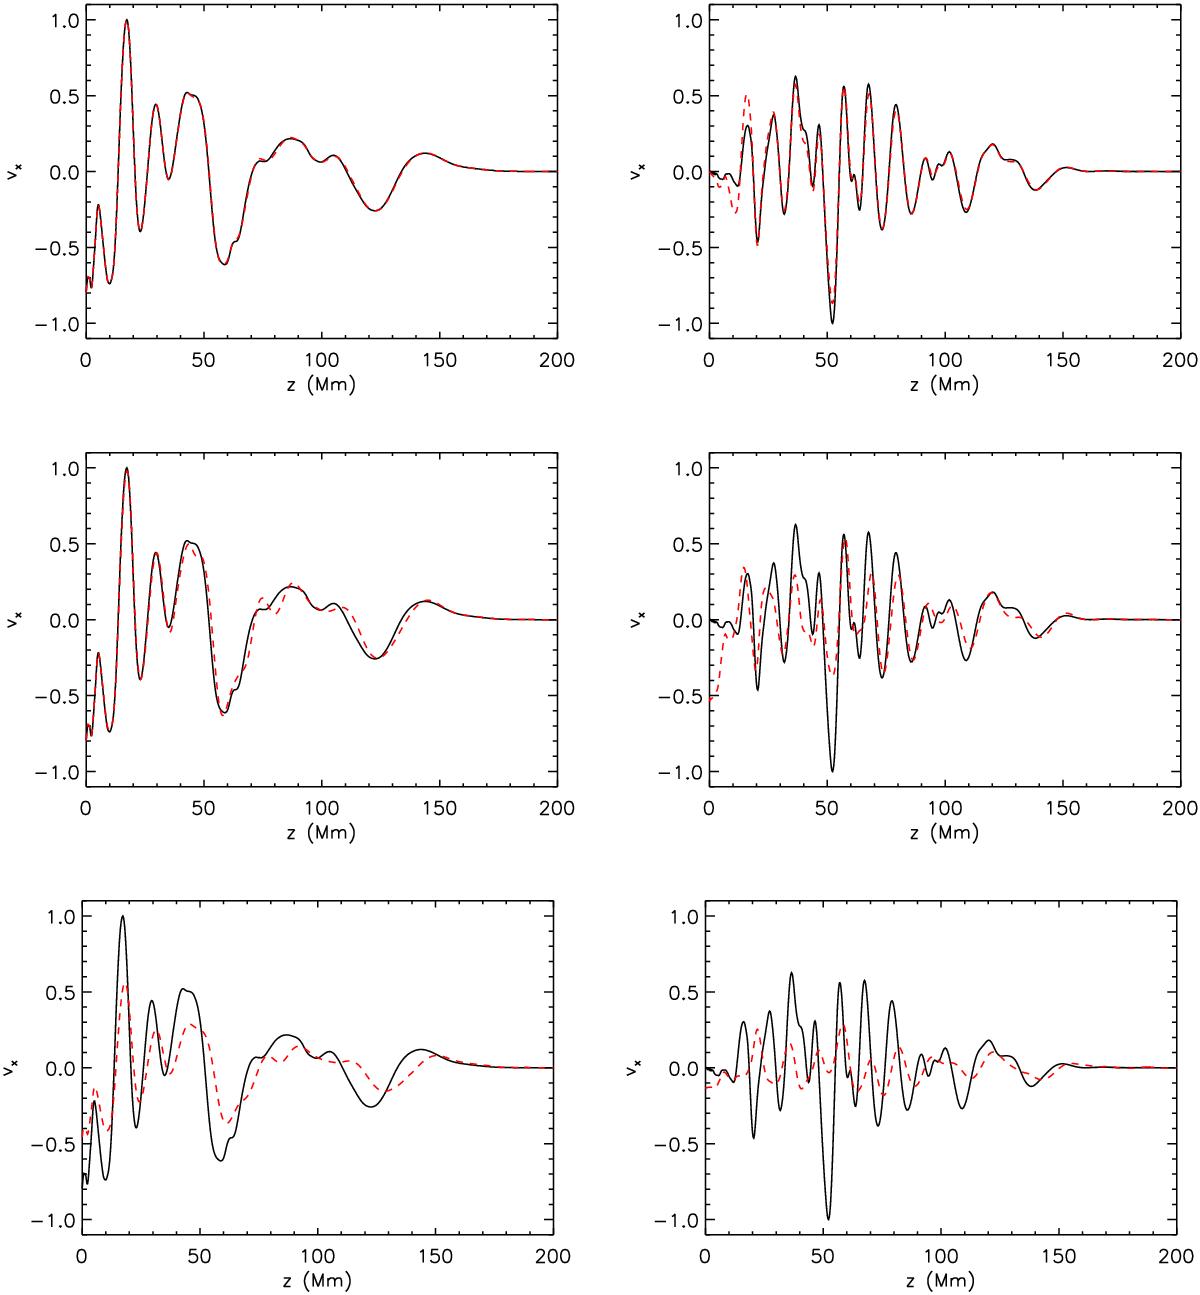
Transverse velocity signals vx at the loop axis (solid lines) compared with spatially averaged signals (red dashed lines) given by Eq. (34). Left column: dipolar driver and right column: turbulent driver. The top panels are for averaging over ra = 0.2 Mm, the middle panels for ra = 0.5 Mm, and the bottom panels for ra = 1 Mm.
Current usage metrics show cumulative count of Article Views (full-text article views including HTML views, PDF and ePub downloads, according to the available data) and Abstracts Views on Vision4Press platform.
Data correspond to usage on the plateform after 2015. The current usage metrics is available 48-96 hours after online publication and is updated daily on week days.
Initial download of the metrics may take a while.