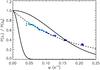
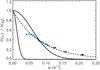
Fig. 10
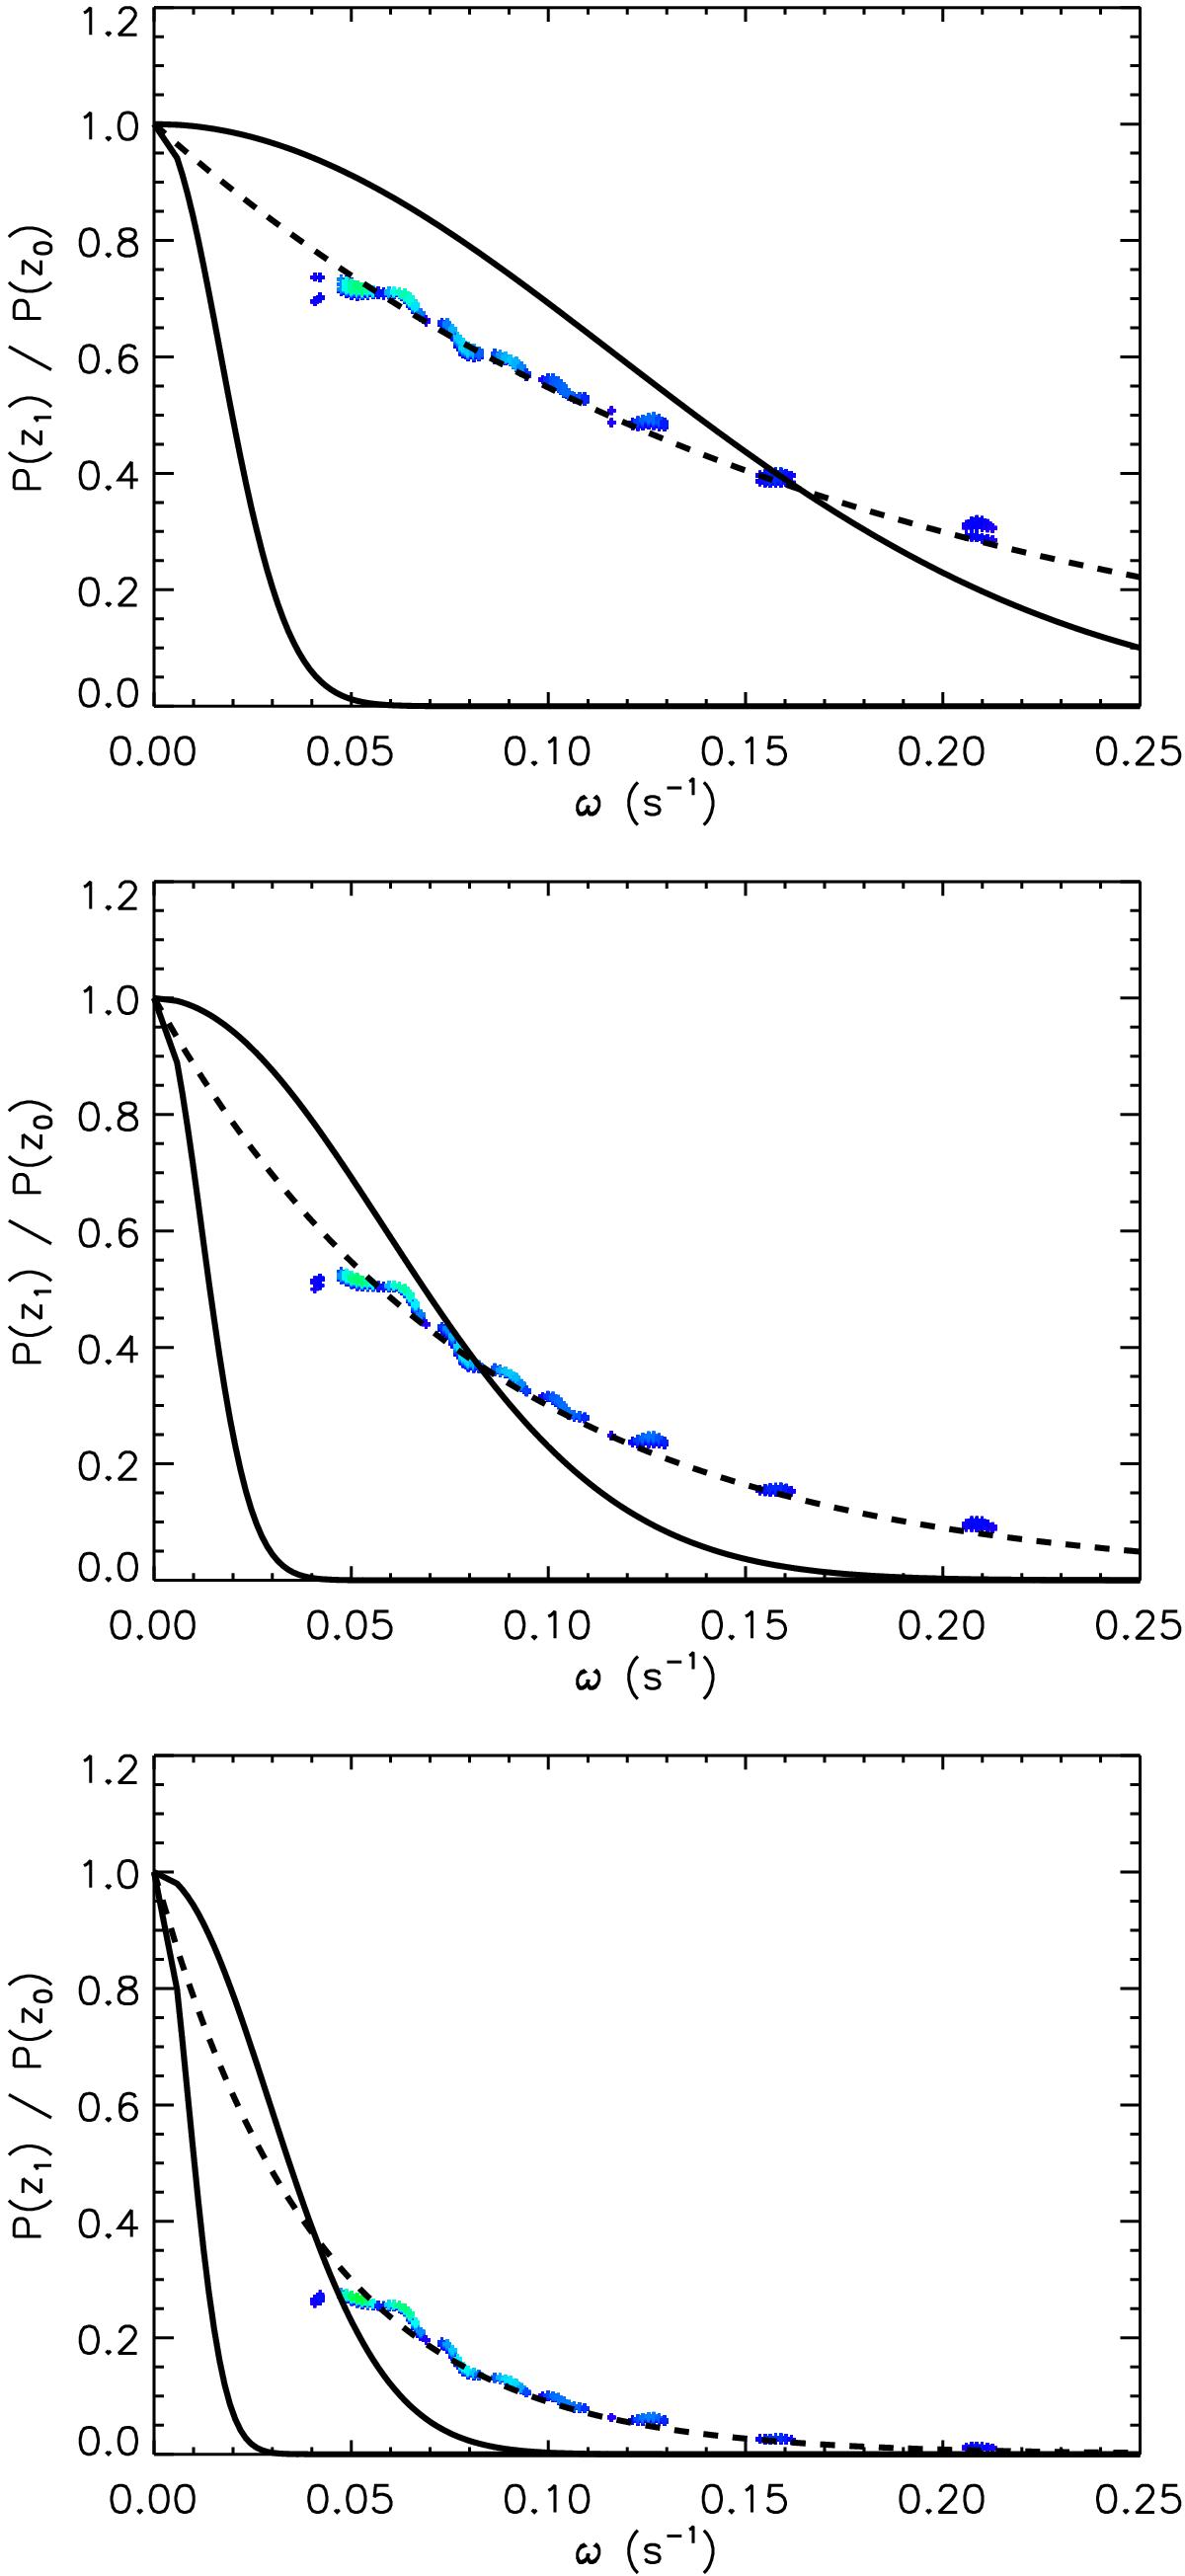
Spectral power ratio for separation distances of Δz = 40 (top), 80 (middle) and 160 Mm (bottom) for ρ0/ρe = 10 and ϵ = 0.1. The dashed and solid curves represent analytical expressions for the exponential and Gaussian spatial damping profiles, respectively. The exponential damping ratio is recovered by only considering points at a sufficiently large height z>h.
Current usage metrics show cumulative count of Article Views (full-text article views including HTML views, PDF and ePub downloads, according to the available data) and Abstracts Views on Vision4Press platform.
Data correspond to usage on the plateform after 2015. The current usage metrics is available 48-96 hours after online publication and is updated daily on week days.
Initial download of the metrics may take a while.