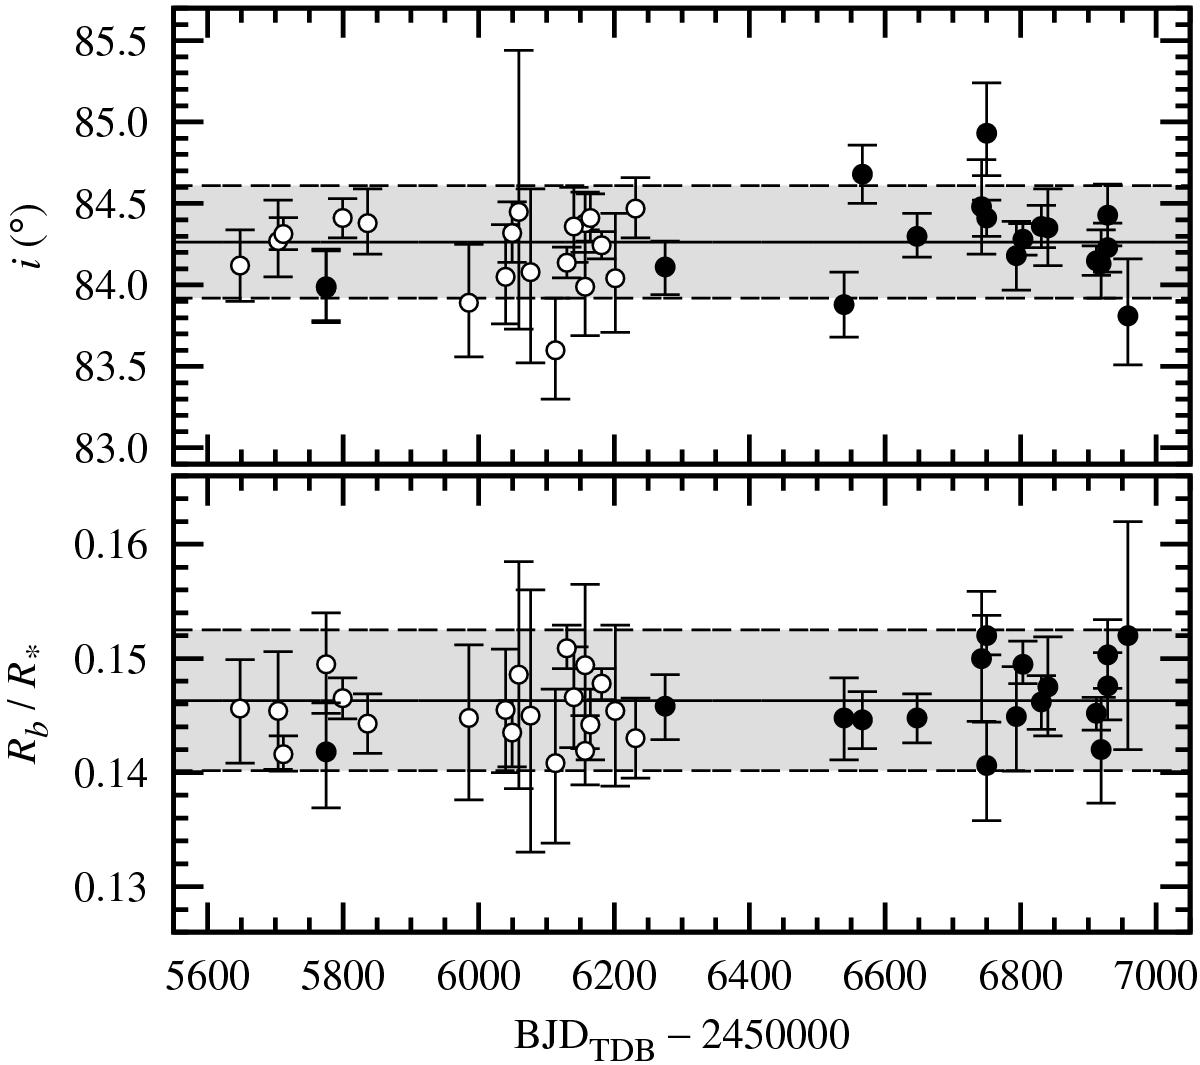
Fig. 3

Distribution of ib and Rb/R∗ in a function of time for a trial fit, in which both parameters were allowed to vary for individual complete transit light curves. Open and filled symbols represent the literature and our new datasets, respectively. Continuous lines denote weighted mean values. Grayed areas between dashed lines show uncertainties at the confidence level of 95.5%, i.e. 2σ, where σ is the weighted standard deviation.
Current usage metrics show cumulative count of Article Views (full-text article views including HTML views, PDF and ePub downloads, according to the available data) and Abstracts Views on Vision4Press platform.
Data correspond to usage on the plateform after 2015. The current usage metrics is available 48-96 hours after online publication and is updated daily on week days.
Initial download of the metrics may take a while.


