| Issue |
A&A
Volume 577, May 2015
|
|
|---|---|---|
| Article Number | A32 | |
| Number of page(s) | 5 | |
| Section | Stellar atmospheres | |
| DOI | https://doi.org/10.1051/0004-6361/201525908 | |
| Published online | 27 April 2015 | |
Research Note
On X-ray pulsations in β Cephei-type variables⋆
1
Institute of Physics and Astronomy, University of Potsdam,
14476
Potsdam,
Germany
e-mail:
lida@astro.physik.uni-potsdam.de
2
Massachusetts Institute of Technology, Kavli Institute for
Astrophysics and Space Research, 70
Vassar St., Cambridge, MA
02139,
USA
3
Leibniz Institute for Astrophysics Potsdam (AIP),
An der Sternwarte 16,
14482
Potsdam,
Germany
4
Department of Physics and Astronomy, East Tennessee State
University, Johnson
City, TN
37663,
USA
5
South African Astronomical Observatory, PO Box 9, Observatory
7935
Cape Town, South
Africa
Received: 16 February 2015
Accepted: 9 March 2015
Context. β Cep-type variables are early B-type stars that are characterized by oscillations observable in their optical light curves. At least one β Cep-variable also shows periodic variability in X-rays.
Aims. Here we study the X-ray light curves in a sample of β Cep-variables to investigate how common X-ray pulsations are for this type of stars.
Methods. We searched the Chandra and XMM-Newton X-ray archives and selected stars that were observed by these telescopes for at least three optical pulsational periods. We retrieved and analyzed the X-ray data for κ Sco, β Cru, and α Vir. The X-ray light curves of these objects were studied to test for their variability and periodicity.
Results. While there is a weak indication for X-ray variability in β Cru, we find no statistically significant evidence of X-ray pulsations in any of our sample stars. This might be due either to the insufficient data quality or to the physical lack of modulations. New, more sensitive observations should settle this question.
Key words: stars: massive / stars: variables: general / X-rays: stars
© ESO, 2015
1. Introduction
Oscillating stars can be found almost everywhere in the HR diagram. The hottest and most massive oscillating stars are β Cephei-type variables. Born with masses between 8 M⊙ and 18 M⊙, and while still young and burning hydrogen in their cores, these B0–B2 type stars pulsate with periods of a few hours. The physical mechanism that drives these oscillations is understood well and attributed to changes in the opacity inside the star during the pulsation cycle (“κ-mechanism”, Dziembowski & Pamiatnykh 1993).
Like other hot massive stars, β Cep-type variables drive stellar winds by their intense UV radiation. Photons that are scattered or absorbed in spectral lines transfer their momentum and thus accelerate the matter to supersonic velocities. This driving mechanism is unstable. It is generally believed that the wind instability results in shocks where part of the wind material is heated to X-ray emitting temperatures (e.g., Feldmeier et al. 1997a).
In β Cep-type variables, the deposition of mechanical energy from stellar pulsations can provide additional heating of the inner wind regions. This idea was put forward to explain the observed excess in the extreme UV spectrum of β CMa (Cassinelli et al. 1996). Recent work on classical Cepheids (Neilson & Lester 2008; Engle et al. 2014) has demonstrated that pulsations may power X-ray emission even from such cool stars. Thus, it seems reasonable to assume that stellar oscillations are closely linked with the X-ray production in β Cep variables.
Recently, it has been found that X-rays from the strongly magnetic β Cep-variable ξ1 CMa pulsate in phase with the optical light curve1 (Oskinova et al. 2014). To investigate whether ξ1 CMa is a unique anomaly or if other β Cep-variables are also X-ray pulsators, we searched the X-ray archives for observations of β Cep-variables. The archival data for a selected sample of variable were analyzed to extract the X-ray light curves (see Fig. 1) and study their variability. In this Research Note we present the results of this study.
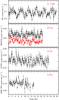 |
Fig. 1 X-ray light curves in 0.2–10.0 keV band of β Cep-type variables binned by 1000 s. The count rate of ξ1 CMa is at least an order of magnitude higher than for the other stars. The horizontal axis shows the time after the start of the observation. Vertical bars represent 1σ errors. From top to bottom: the EPIC PN light curve of ξ1 CMa; the HETG (added +1 and −1order) light curve of β Cru, where the lower red light curve is in the hard band (1.0−10.0 keV) where the detection of pulsations was claimed by Cohen et al. (2008); LETG (added +1 and −1 order) light curve of α Vir; EPIC PN light curve of κ Sco. |
2. Previous investigations of X-ray pulsations in β Cep-variables
Despite being a numerous and astrophysically important class of objects, β Cep-variables have not been studied well in X-rays. The first X-ray survey of six β Cep-type stars was performed with the Einstein observatory (Agrawal et al. 1984). No correlation was found between X-ray and pulsational, rotational, or binary properties.
The interest in X-ray properties of β Cep-variables was renewed with the launch of the ROSAT X-ray observatory. Four β Cep stars were among the sample of 12 nearby near-main-sequence B-stars observed by ROSAT (Cassinelli et al. 1994). Timing analysis was performed for all targets, but no variability was found except those attributed to the spacecraft wobble.
ROSAT observations of β Cep-variables were further analyzed for the presence of X-ray pulsations by Cohen (2000), who mentions detecting periodic X-ray variability in four β Cephei-type variables. Specifically, for the star β Cephei, it was shown that the hypothesis of a constant source can be rejected with 98% confidence (see Fig. 5 in Cohen 2000). Cohen (2000) reports that the X-ray variability of β Cep is periodic with the same period as stellar pulsational period in the optical.
The binary system β Cep consists of a primary magnetic B2III-type star (Donati et al. 2001) and a secondary B6-B8e type star (Schnerr et al. 2006). The magnetosphere of the primary was studied in detail by Donati et al. (2001). It was predicted that an equatorial disk-like structure would be present around this star. A signature of such a disk was found using interferometry by Nardetto et al. (2011).
The occultations of X-ray emission sites by the disk should lead to observable X-ray variability on the rotational time scale. To test this hypothesis, the more sensitive XMM-Newton and Chandra observations of β Cep were obtained. However, only limited evidence of a modulation in the X-ray emission was found (Favata et al. 2009). The variability was observed at a 5% level but in anti-phase with the model predictions. Furthermore, Favata et al. (2009) performed a dedicated time analysis of the XMM-Newton light curves but did not uncover any periodicity, thus questioning the results of Cohen (2000). It was concluded that “the fact that Cohen (2000) did not perform a period search, but rather assumed the period and fitted the amplitude and phase, makes it likely that the period reported by Cohen (2000) is spurious” (Favata et al. 2009).
An assumed period was also fitted to the X-ray light curve β Cep-variable β Cru obtained with the Chandra X-ray observatory (Cohen et al. 2008). These authors applied a Kolmogorov-Smirnov test to the unbinned photon arrival times, as well as a χ2 fitting of a constant source model to the binned light curve and found no evidence of X-ray variability. However, when a grid of test periods was fitted to the phased photon arrival times, it was found that for the X-ray light curve in the hard band (hν> 1 keV), the rejection probabilities for some of the assumed periods were quite low. This was the basis for suggesting that the periodic variability is detected with a period P = 4.588 h, which is the primary pulsation mode period in β Cru. However, Aerts et al. (2014) give the dominant frequency in β Cru as 5.95867 d-1 (or 4.0277 h). Polarimetric measurements for β Cru did not reveal any magnetic field (Hubrig et al. 2006). We revisit the archival X-ray observations of β Cru in Sect. 3.1.
XMM-Newton and Chandra observations of β Cep-variables covering at least three stellar pulsational periods.
Log of analysed observations.
Another β Cep-variable that has been studied in X-rays is β Cen. This is a binary system consisting of two β Cep-type stars of nearly equal mass with an orbital period of 357 days (Ausseloos et al. 2006, and references therein). The primary rotates significantly faster (νsini = 190 ± 20 km s-1) than the secondary (νsini = 75 ± 15 km s-1), as is evident from its rotationally broadened lines. The magnetic nature of the secondary, the slower rotating component in β Cen is reported by Alecian et al. (2011).
Sensitive observations of β Cen with XMM-Newton are reported by Raassen et al. (2005). The X-ray light curves with different time binnings and energy bands were extracted from data obtained by all XMM-Newton instruments and their combinations. Scargle periodograms were produced but no periodicities with high statistical confidence found in any of the data sets. Moreover, no hint of periodicity with the period seen in optical light curves was found even with low statistical confidence. However, when the light curves were compared with the constant source hypothesis, probabilities of 83% (for EPIC PN) and 49% (for EPIC MOS) were determined for the source not being constant.
Oskinova et al. (2011c) considered a small sample of β Cep-variables with well known pulsational behavior and existing X-ray observations and searched for correlations between pulsational and X-ray properties. After confirming previous results known from the Einstein and ROSAT works, no clear relations could be found. This could be due to the very limited sample.
The sample of β Cep-variable with X-ray light curves of sufficient quality is very small. It is observationally challenging to obtain X-ray light curves of high enough quality to establish periodic variability with high statistical significance. The stellar oscillations periods are typically four to six hours. To confidently detect pulsations in a light curve, the observations should be long enough to cover a number of periods. (In this study we adopt the minimum of three periods.) At the same time, the source should be X-ray bright in order to have enough counts per time bin for a meaningful statistical analysis. In Table 1 we summarize the objects that satisfy the above criteria.
3. Looking for the variability in X-ray light curves of β Cru, κ Sco, and α Vir
3.1. β Cru
We retrieved the archival Chandra X-ray observations of β Cru (see Table 2) and analyzed them using the latest calibration. The X-ray light curves were extracted in different energy bands as defined in Cohen et al. (2008): full (0.4−10.0 keV), soft (0.4−1.0 keV ), and hard (1.0−10.0 keV). The light curves were binned in the 1000 s and 3600 s bins, and examples of light curves are shown in Fig. 1.
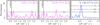 |
Fig. 2 Power density spectra based on the Fourier transform (Scargle 1982; Horne & Baliunas 1986) of X-ray light curves. The periodogram was calculated from ν = 1 /P to ν = N0/P with a spacing P-1, where N0 is the number of data points. Various false alarm probability levels are marked. From left to right: 1) combined zero and first-order Chandra HETGS light curve of β Cru in hard (1.−10.0 keV) band where pulsations were suggested by Cohen et al. (2008). There is about a 50% probability that this period is spurious; 2) zero-order Chandra’s HETGS light curve of β Cru in full (0.2−10.0 keV) band, there is more than a 50% probability that this period is spurious; 3) EPIC PN light curve of ξ1 CMa in hard band (0.7−10.0 keV). |
For HETG dispersed photon data, we computed light curves using the ACIS-Grating-Light-Curve (aglc) program (used by the Chandra Grating-Data Archive and Catalog processing TGCat, Huenemoerder et al. 2011), in order to also produce a curve in the hard band, in addition to the default broad-band curve available from TGCat. Zeroth-order curves (not shown) were created with the CIAO (Fruscione et al. 2006) program, dmextract. The program aglc computes rates with the explicit exposure records for each CCD, using the user-specified combination of grating types, orders, and bandpasses. For relatively low count-rate systems, such as those analyzed here, with time binning comparable to the dither period and with broad energy ranges spanning all CCDs, chip-to-chip differences and chip gap effects are negligible. Furthermore, for the dispersed photons, there is no concern with light leaks, as there could be for zeroth orders of optically bright objects.
Using the χ2 test, the X-ray light curves were compared with those expected from the constant source hypothesis. As an example, for the zeroth-order light curve in full band and binned by 1000 s, the probability value is P ≈ 0.168, which implies that the probability that the observed variability is solely a chance occurrence is less than ≈17%, which is statistically insignificant. Thus, the null-hypothesis assuming that the source is constant cannot be rejected. On the other hand, for the same light curve but binned into 3000 s, P ≈ 0.0044, which is statistically significant at the level α = 0.01. In the hard band, for the combined zeroth- and first-order light curve, P ≈ 0.06 is statistically insignificant with α = 0.05.
Thus, similar to the case of β Cen, there are marginal indications of source variability. To investigate the presence of periodic modulations further, we constructed Scargle periodograms, with some examples shown in Fig. 2. A peak with a false alarm probability of about 50% is present at the frequency close to the stellar pulsational period. However, this is not the most prominent feature in the periodograms. For comparison, we show in Fig. 2 a periodogram of the ξ1 CMa in 0.7−10.0 keV (hard) band, where the peak at the stellar pulsation frequency has a false alarm probability less than 1%.
Thus, from reanalysis of the Chandra data on β Cru, we must conclude that in the statistical sense, it is likely that the period reported by Cohen et al. (2008) is spurious. Better quality observations are needed to establish whether the periodicity is indeed present in β Cru’s X-ray light curve.
3.2. X-ray variability of κ Sco
The spectroscopic binary system, κ Sco, has two B-type components orbiting with a period of 195 d. The primary (B1.5III) is responsible for the pulsational variability (Harmanec et al. 2004) observed photometrically with a main period of 4.797 h (Handler & Schwarzenberg-Czerny 2013).
We retrieved the archival XMM-Newton observations of κ Sco (see Table 2) and reprocessed them using the most recent data analysis software (SAS 14.0.0) and calibration files. The source κ Sco has a visual magnitude mV = 2.4, therefore the thickest optical light blocking filter was used in observation. For the XMM-Newton detectors operating in full-frame mode and with the thick filter, no optical loading is expected for stars with mV> −2 mag (for the PN camera).
Unfortunately, the observations were affected by the high background from proton flares. The observations were filtered using good time intervals resulting in a useful exposure time of 44 ks. Here, κ Sco is sufficiently isolated without nearby X-ray sources. From the region with radius 25′′ and centered on the coordinates of κ Sco, we extracted the EPIC PN light curve in 0.2–10.0 keV energy band and restricting the patterns to single and double events. Background regions were carefully selected on the same CCD. The net light curves with different time binnings were produced using the epiclccorr task. As a next step, the X-ray light curves were tested for variability. As an example, in the full band and binned with a 1000 s light curve, the probability value P ≈ 0.83 is not significant even with α = 0.1. Thus, the null hypothesis about the X-ray light curve from κ Sco being constant cannot be rejected. No useful information about the presence of periodic variability could be obtained on the basis of Fourier periodograms, owing to the limited quality of the data.
3.3. X-ray variability of α Vir
Spica (α Vir) is a spectroscopic binary with a period of ~4 d in an eccentric orbit. The primary component (B1.5IV-V) is classified as a β Cep-type variable, but its pulsational behavior is not stable (see discussion in Palate et al. 2013).
Spica was observed by Chandra LETG for 90 180 s in 2005-03-15 (Chandra observation identifier 4509). We retrieved the X-ray light curves (see Fig. 1) from the TGCat and tested them for variability. As mentioned above, there is no concern about optical or UV light leakage since we are not using the zeroth-order photons. For extremely high UV flux sources, the LETG coarse support structure acts as a crude disperser, and it can sometimes produce spurious signal for LETG used with HRC-S (Drake 2010), but we see no such evidence in this LETG/ACIS-S spectrum.
Based on the χ2-test, the chance probability value P ≈ 0.19 is not significant. We went on to conduct a period search, but all peaks in the Fourier periodogram are statistically insignificant (see Fig. 3). No useful information on the X-ray variability was obtained from other statistical tests either. Moreover, in the case of α Vir with its unstable pulsational behavior in order to reach any conclusions about the correlation between stellar oscillations and X-ray variability, it would be necessary to observe the star simultaneously in X-rays and in optical.
The Chandra observations of α Vir lasted for about 25 h, thus covering about a quarter of the orbital period of this binary star. Although no optical eclipses have been observed in this system (Palate et al. 2013), an influence of binarity on the X-ray light curve cannot be excluded a priori.
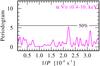 |
Fig. 3 Power density spectrum based on the Fourier transform (Scargle 1982; Horne & Baliunas 1986) of X-ray light curve (0.4−10.0 keV) of α Vir. The false alarm probability at 50% level is marked. |
4. Discussion
Our study of a small sample of X-ray lightmcurves from β Cep-variables did not reveal any periodic variability. However, the X-ray count rate of the only star where the X-ray pulsations are clearly detected, ξ1 CMa, is much greater than for the other stars considered here. It is important to assess what the upper limit is on an amplitude of modulation that could have been detected in our sample stars with the available data.
We therefore wish to study a star with a periodic signal of relative amplitude A and N counts per pulsational period. The noise level can be approximated as  , where np is the number of periods. We assume that a significant detection must be a factor 4 × higher than the noise level. Thus, we can derive the minimum detectable amplitude for a given observation. The results are shown in Table 1. Only for κ Sco the sensitivity of observations was marginally sufficient to detect a variability on a level of about 10%. The data sets for β Cru and α Vir are not good enough to uncover periodic variability on a level similar to that seen in ξ1 CMa even if it were present.
While we did not found any periodic pulsations, our analysis showed that some of the sample stars show marginal evidence of X-ray variability. For some β Cep-type variables, such variability has also been previously reported in the literature.
Significant stochastic X-ray variability is expected in the models of X-ray generation in stellar winds (Feldmeier et al. 1997b; Oskinova et al. 2001b). However, the most sensitive X-ray observations of an O-type star (the XMM-Newton observations of ζ Puppis with the total exposure time of about 1 Ms) revealed a surprising lack of short time-scale stochastic variability (Nazé et al. 2013).
On the other hand, the evidence is accumulating that the X-ray variability associated with stellar rotation may be present in massive star winds. Berghoefer et al. (1996) observed the supergiant ζ Puppis for 11 days and found modulations with a frequency of 1.44 d-1 in the Hα line profiles, as well as in the X-rays in the 0.9−2.0 keV band. They reported an amplitude of X-ray variability of 6% and suggested that these variations are periodic. This suggestion was not confirmed by later studies based on ASCA and XMM-Newton observations (Oskinova et al. 2001a; Nazé et al. 2013). Howarth & Stevens (2014) reported the detection of a period P = 1.780 d in optical light curves of ζ Puppis and suggested that this period may be due stellar pulsations. While indeed the X-ray modulations on a time scale of a day are present in ζ Puppis, no coherent periodicity in X-ray emission has been confirmed for this object so far.
Periodic modulations of X-ray emission were reported for the O-type dwarf ζ Oph (Oskinova et al. 2001a). However, also in this case, we lack any information on the repeatability of X-ray modulations. Two other O-type stars, ξ Per (Massa et al. 2014) and ζ Ori (Pollock, priv. comm.), also show modulations of X-ray emission on a time scale of days. Interestingly, XMM-Newton observations of a Wolf-Rayet type star, WR 6 showed that its X-ray light curve changes quasi-periodically (Ignace et al. 2013). We speculate that, similar to WR 6, in the OB-type stars the X-ray variability owing to the rotation has quasi-periodic character.
A small fraction of B-type stars possess strong magnetic fields (e.g., Hubrig et al. 2006; Morel et al. 2014, and references therein). If a magnetic field has a dipole configuration, it can channel the wind toward the magnetic equator, where wind streams from opposite hemispheres collide and produce a strong shock (magnetically confined wind shock (MCWS), Babel & Montmerle 1997; Ud-Doula et al. 2014). The MCWS predicts the X-ray variability of magnetic massive stars associated with the stellar rotation due to the occupation of X-ray emitting regions by the cold torus of matter accumulated in the equatorial plane (Donati et al. 2001, 2002). Such X-ray modulations on a rotational time scale are sometimes observed (e.g., Gagné et al. 1997; Pillitteri et al. 2014); however, this is not ubiquitous behavior among magnetic massive stars – some of these well-known objects, such as τ Sco, do not show any evidence of X-ray variability over the stellar rotation period (Ignace et al. 2010).
The data sets that we consider in this paper do not cover long enough time intervals to test the X-ray light curves for modulations due to stellar rotation or orbital motion. Thus, it is not clear what the true nature is of X-ray variability observed in some of our sample stars.
However, in none of our sample stars, β Cru, κ Sco, or α Vir, do we find statistically significant evidence for periodic X-ray variability. Up to now, the unambiguous presence of X-ray pulsations with the same period and in phase with the optical light curve has only been detected in the magnetic star ξ1 CMa. It remains to be seen whether this object is exceptional or if new,
better quality observations will reveal similar properties in other β Cep-variables.
Acknowledgments
We are grateful to the referee for useful and constrictive comments. This research made use of the Chandra Transmission Grating Catalog and archive (http://tgcat.mit.edu), the SIMBAD database, operated at the CDS, Strasbourg, France, and NASA’s Astrophysics Data System. L.M.O. acknowledges support from DLR grant 50 OR 1302.
References
- Aerts, C., Simón-Díaz, S., Groot, P. J., & Degroote, P. 2014, A&A, 569, A118 [NASA ADS] [CrossRef] [EDP Sciences] [Google Scholar]
- Agrawal, P. C., Singh, K. P., Riegler, G. R., & Stern, R. A. 1984, MNRAS, 208, 845 [NASA ADS] [CrossRef] [Google Scholar]
- Alecian, E., Kochukhov, O., Neiner, C., et al. 2011, A&A, 536, L6 [NASA ADS] [CrossRef] [EDP Sciences] [Google Scholar]
- Ausseloos, M., Aerts, C., Lefever, K., Davis, J., & Harmanec, P. 2006, A&A, 455, 259 [NASA ADS] [CrossRef] [EDP Sciences] [Google Scholar]
- Babel, J., & Montmerle, T. 1997, A&A, 323, 121 [NASA ADS] [Google Scholar]
- Berghoefer, T. W., Baade, D., Schmitt, J. H. M. M., et al. 1996, A&A, 306, 899 [NASA ADS] [Google Scholar]
- Cassinelli, J. P., Cohen, D. H., Macfarlane, J. J., Sanders, W. T., & Welsh, B. Y. 1994, ApJ, 421, 705 [NASA ADS] [CrossRef] [Google Scholar]
- Cassinelli, J. P., Cohen, D. H., Macfarlane, J. J., et al. 1996, ApJ, 460, 949 [NASA ADS] [CrossRef] [Google Scholar]
- Cohen, D. H. 2000, in The Be Phenomenon in Early-Type Stars, eds. M. A. Smith, H. F. Henrichs, & J. Fabregat, IAU Colloq. 175, ASP Conf. Ser., 214, 156 [Google Scholar]
- Cohen, D. H., Kuhn, M. A., Gagné, M., Jensen, E. L. N., & Miller, N. A. 2008, MNRAS, 386, 1855 [NASA ADS] [CrossRef] [Google Scholar]
- Donati, J., Wade, G. A., Babel, J., et al. 2001, MNRAS, 326, 1265 [NASA ADS] [CrossRef] [Google Scholar]
- Donati, J., Babel, J., Harries, T. J., et al. 2002, MNRAS, 333, 55 [NASA ADS] [CrossRef] [MathSciNet] [Google Scholar]
- Drake, J. 2010, Chandra News, 17, 21 [NASA ADS] [Google Scholar]
- Dziembowski, W. A., & Pamiatnykh, A. A. 1993, MNRAS, 262, 204 [NASA ADS] [CrossRef] [Google Scholar]
- Engle, S. G., Guinan, E. F., Harper, G. M., Neilson, H. R., & Remage Evans, N. 2014, ApJ, 794, 80 [NASA ADS] [CrossRef] [Google Scholar]
- Favata, F., Neiner, C., Testa, P., Hussain, G., & Sanz-Forcada, J. 2009, A&A, 495, 217 [NASA ADS] [CrossRef] [EDP Sciences] [Google Scholar]
- Feldmeier, A., Kudritzki, R., Palsa, R., Pauldrach, A. W. A., & Puls, J. 1997a, A&A, 320, 899 [NASA ADS] [Google Scholar]
- Feldmeier, A., Puls, J., & Pauldrach, A. W. A. 1997b, A&A, 322, 878 [NASA ADS] [Google Scholar]
- Fruscione, A., McDowell, J. C., Allen, G. E., et al. 2006, in SPIE Conf. Ser., 6270 [Google Scholar]
- Gagné, M., Caillault, J.-P., Stauffer, J. R., & Linsky, J. L. 1997, ApJ, 478, L87 [NASA ADS] [CrossRef] [Google Scholar]
- Handler, G., & Schwarzenberg-Czerny, A. 2013, A&A, 557, A1 [NASA ADS] [CrossRef] [EDP Sciences] [Google Scholar]
- Harmanec, P., Uytterhoeven, K., & Aerts, C. 2004, A&A, 422, 1013 [NASA ADS] [CrossRef] [EDP Sciences] [Google Scholar]
- Horne, J. H., & Baliunas, S. L. 1986, ApJ, 302, 757 [NASA ADS] [CrossRef] [Google Scholar]
- Howarth, I. D., & Stevens, I. R. 2014, MNRAS, 445, 2878 [NASA ADS] [CrossRef] [Google Scholar]
- Hubrig, S., Briquet, M., Schöller, M., et al. 2006, MNRAS, 369, L61 [NASA ADS] [CrossRef] [Google Scholar]
- Huenemoerder, D. P., Mitschang, A., Dewey, D., et al. 2011, AJ, 141, 129 [NASA ADS] [CrossRef] [Google Scholar]
- Ignace, R., Oskinova, L. M., Jardine, M., et al. 2010, ApJ, 721, 1412 [NASA ADS] [CrossRef] [Google Scholar]
- Ignace, R., Gayley, K. G., Hamann, W.-R., et al. 2013, ApJ, 775, 29 [NASA ADS] [CrossRef] [Google Scholar]
- Massa, D., Oskinova, L., Fullerton, A. W., et al. 2014, MNRAS, 441, 2173 [NASA ADS] [CrossRef] [Google Scholar]
- Morel, T., Castro, N., Fossati, L., et al. 2014, The Messenger, 157, 27 [NASA ADS] [Google Scholar]
- Nardetto, N., Mourard, D., Tallon-Bosc, I., et al. 2011, A&A, 525, A67 [NASA ADS] [CrossRef] [EDP Sciences] [Google Scholar]
- Nazé, Y., Oskinova, L. M., & Gosset, E. 2013, ApJ, 763, 143 [NASA ADS] [CrossRef] [Google Scholar]
- Neilson, H. R., & Lester, J. B. 2008, ApJ, 684, 569 [NASA ADS] [CrossRef] [Google Scholar]
- Oskinova, L. M., Clarke, D., & Pollock, A. M. T. 2001a, A&A, 378, L21 [NASA ADS] [CrossRef] [EDP Sciences] [Google Scholar]
- Oskinova, L. M., Ignace, R., Brown, J. C., & Cassinelli, J. P. 2001b, A&A, 373, 1009 [NASA ADS] [CrossRef] [EDP Sciences] [Google Scholar]
- Oskinova, L. M., Todt, H., Ignace, R., et al. 2011c, MNRAS, 416, 1456 [NASA ADS] [CrossRef] [Google Scholar]
- Oskinova, L. M., Nazé, Y., Todt, H., et al. 2014, Nat. Comm., 5, 4024 [Google Scholar]
- Palate, M., Koenigsberger, G., Rauw, G., Harrington, D., & Moreno, E. 2013, A&A, 556, A49 [NASA ADS] [CrossRef] [EDP Sciences] [Google Scholar]
- Pillitteri, I., Wolk, S. J., Goodman, A., & Sciortino, S. 2014, A&A, 567, L4 [NASA ADS] [CrossRef] [EDP Sciences] [Google Scholar]
- Raassen, A. J. J., Cassinelli, J. P., Miller, N. A., Mewe, R., & Tepedelenlioǧlu, E. 2005, A&A, 437, 599 [NASA ADS] [CrossRef] [EDP Sciences] [Google Scholar]
- Scargle, J. D. 1982, ApJ, 263, 835 [NASA ADS] [CrossRef] [Google Scholar]
- Schnerr, R. S., Henrichs, H. F., Oudmaijer, R. D., & Telting, J. H. 2006, A&A, 459, L21 [NASA ADS] [CrossRef] [EDP Sciences] [Google Scholar]
- Stankov, A., & Handler, G. 2005, ApJS, 158, 193 [NASA ADS] [CrossRef] [Google Scholar]
- Ud-Doula, A., Owocki, S., Townsend, R., Petit, V., & Cohen, D. 2014, MNRAS, 441, 3600 [NASA ADS] [CrossRef] [Google Scholar]
All Tables
XMM-Newton and Chandra observations of β Cep-variables covering at least three stellar pulsational periods.
All Figures
|
Fig. 1 X-ray light curves in 0.2–10.0 keV band of β Cep-type variables binned by 1000 s. The count rate of ξ1 CMa is at least an order of magnitude higher than for the other stars. The horizontal axis shows the time after the start of the observation. Vertical bars represent 1σ errors. From top to bottom: the EPIC PN light curve of ξ1 CMa; the HETG (added +1 and −1order) light curve of β Cru, where the lower red light curve is in the hard band (1.0−10.0 keV) where the detection of pulsations was claimed by Cohen et al. (2008); LETG (added +1 and −1 order) light curve of α Vir; EPIC PN light curve of κ Sco. |
| In the text | |
|
Fig. 2 Power density spectra based on the Fourier transform (Scargle 1982; Horne & Baliunas 1986) of X-ray light curves. The periodogram was calculated from ν = 1 /P to ν = N0/P with a spacing P-1, where N0 is the number of data points. Various false alarm probability levels are marked. From left to right: 1) combined zero and first-order Chandra HETGS light curve of β Cru in hard (1.−10.0 keV) band where pulsations were suggested by Cohen et al. (2008). There is about a 50% probability that this period is spurious; 2) zero-order Chandra’s HETGS light curve of β Cru in full (0.2−10.0 keV) band, there is more than a 50% probability that this period is spurious; 3) EPIC PN light curve of ξ1 CMa in hard band (0.7−10.0 keV). |
| In the text | |
|
Fig. 3 Power density spectrum based on the Fourier transform (Scargle 1982; Horne & Baliunas 1986) of X-ray light curve (0.4−10.0 keV) of α Vir. The false alarm probability at 50% level is marked. |
| In the text | |
Current usage metrics show cumulative count of Article Views (full-text article views including HTML views, PDF and ePub downloads, according to the available data) and Abstracts Views on Vision4Press platform.
Data correspond to usage on the plateform after 2015. The current usage metrics is available 48-96 hours after online publication and is updated daily on week days.
Initial download of the metrics may take a while.