Fig. 1
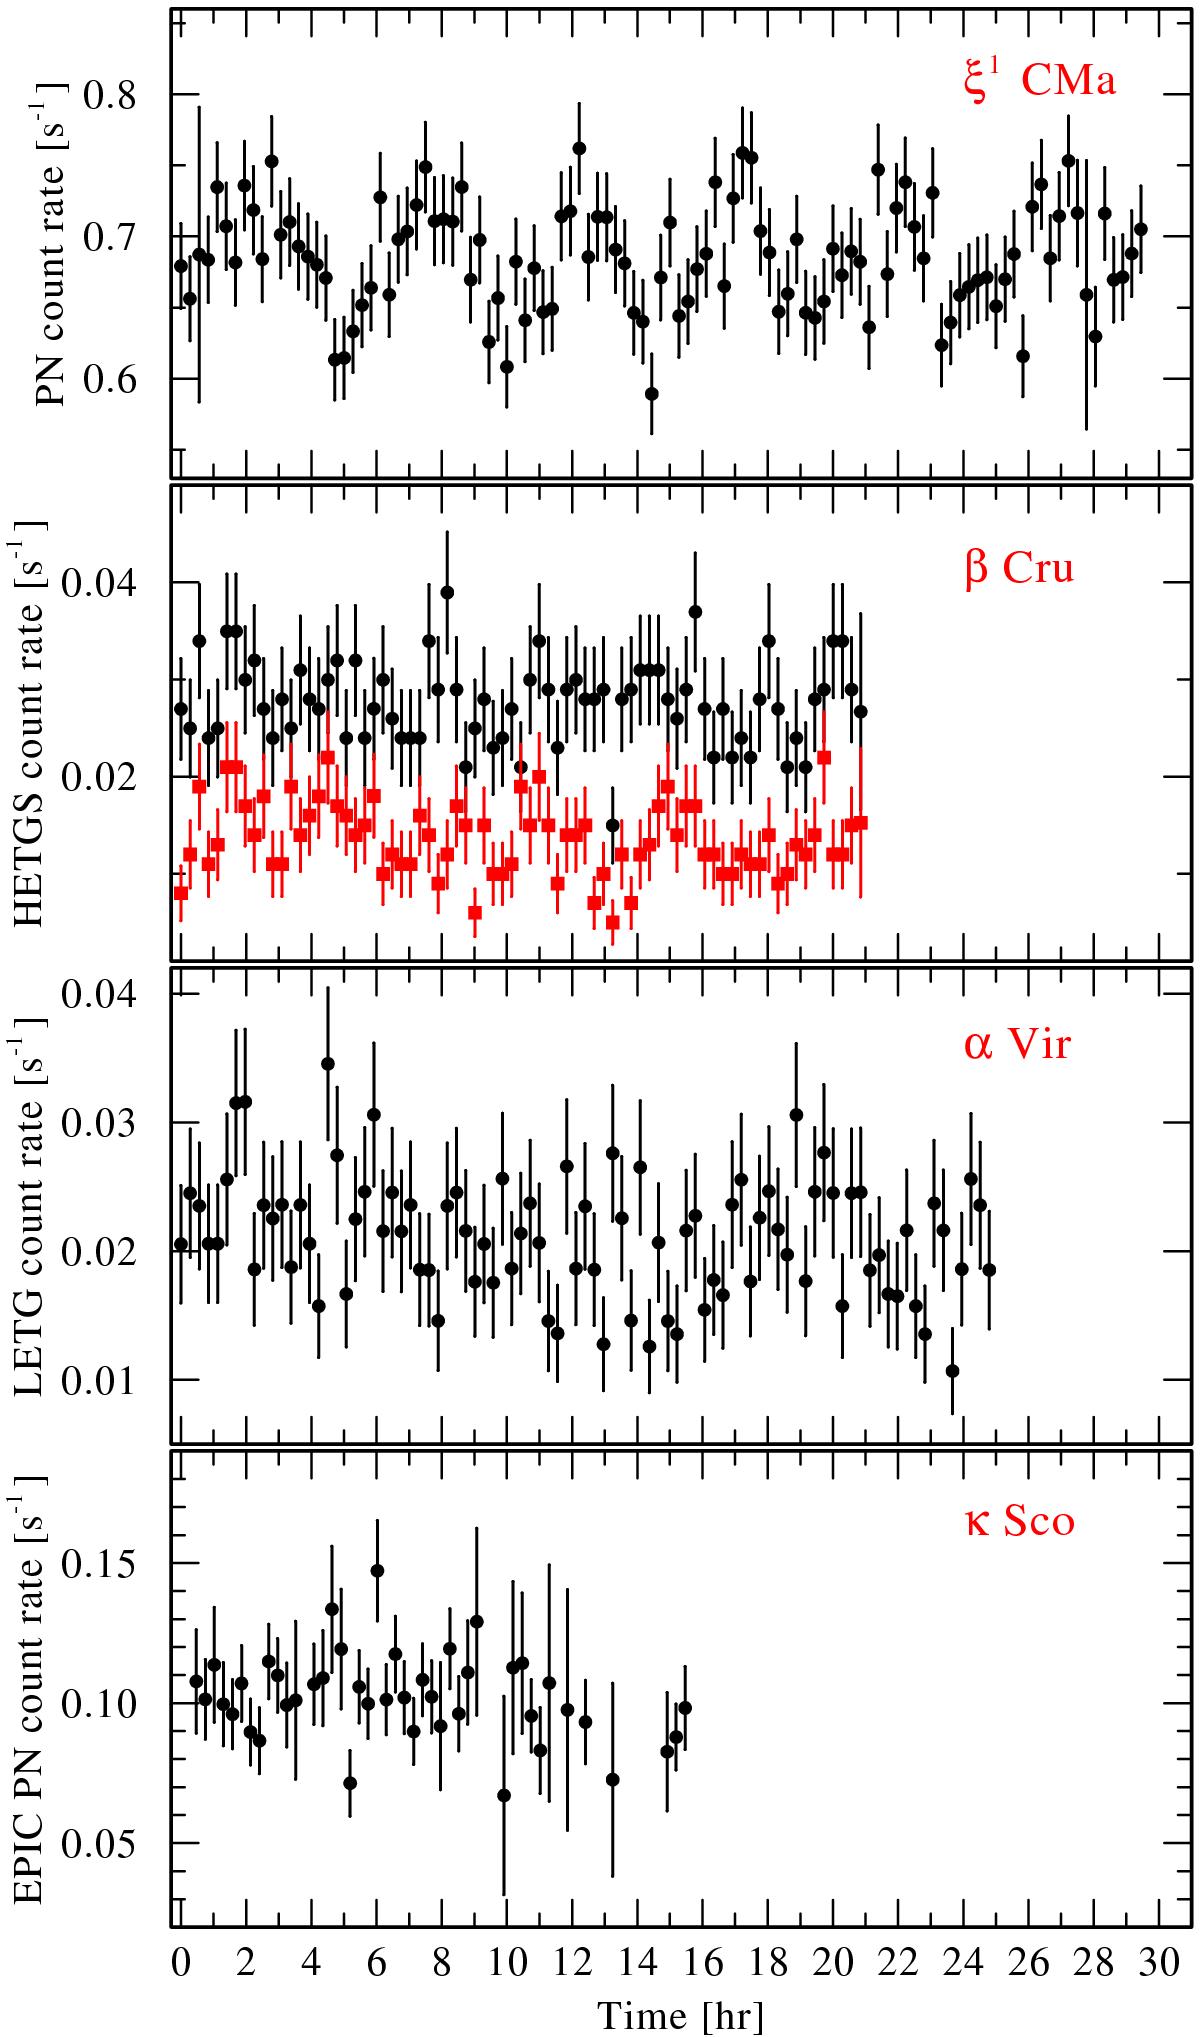
X-ray light curves in 0.2–10.0 keV band of β Cep-type variables binned by 1000 s. The count rate of ξ1 CMa is at least an order of magnitude higher than for the other stars. The horizontal axis shows the time after the start of the observation. Vertical bars represent 1σ errors. From top to bottom: the EPIC PN light curve of ξ1 CMa; the HETG (added +1 and −1order) light curve of β Cru, where the lower red light curve is in the hard band (1.0−10.0 keV) where the detection of pulsations was claimed by Cohen et al. (2008); LETG (added +1 and −1 order) light curve of α Vir; EPIC PN light curve of κ Sco.
Current usage metrics show cumulative count of Article Views (full-text article views including HTML views, PDF and ePub downloads, according to the available data) and Abstracts Views on Vision4Press platform.
Data correspond to usage on the plateform after 2015. The current usage metrics is available 48-96 hours after online publication and is updated daily on week days.
Initial download of the metrics may take a while.