Fig. 2
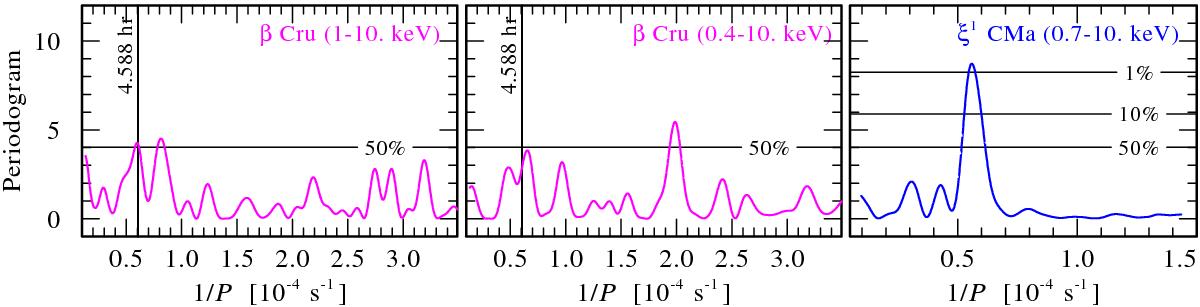
Power density spectra based on the Fourier transform (Scargle 1982; Horne & Baliunas 1986) of X-ray light curves. The periodogram was calculated from ν = 1 /P to ν = N0/P with a spacing P-1, where N0 is the number of data points. Various false alarm probability levels are marked. From left to right: 1) combined zero and first-order Chandra HETGS light curve of β Cru in hard (1.−10.0 keV) band where pulsations were suggested by Cohen et al. (2008). There is about a 50% probability that this period is spurious; 2) zero-order Chandra’s HETGS light curve of β Cru in full (0.2−10.0 keV) band, there is more than a 50% probability that this period is spurious; 3) EPIC PN light curve of ξ1 CMa in hard band (0.7−10.0 keV).
Current usage metrics show cumulative count of Article Views (full-text article views including HTML views, PDF and ePub downloads, according to the available data) and Abstracts Views on Vision4Press platform.
Data correspond to usage on the plateform after 2015. The current usage metrics is available 48-96 hours after online publication and is updated daily on week days.
Initial download of the metrics may take a while.