| Issue |
A&A
Volume 577, May 2015
|
|
|---|---|---|
| Article Number | A115 | |
| Number of page(s) | 10 | |
| Section | Interstellar and circumstellar matter | |
| DOI | https://doi.org/10.1051/0004-6361/201425552 | |
| Published online | 13 May 2015 | |
Strong effect of the cluster environment on the size of protoplanetary discs?
Max Planck Institute for Radio Astronomy, Auf dem Hügel 69, 53121 Bonn, Germany
e-mail: This email address is being protected from spambots. You need JavaScript enabled to view it.
Received: 19 December 2014
Accepted: 10 April 2015
Abstract
Context. Most stars are born in clusters, thus the protoplanetary discs surrounding the newly formed stars might be influenced by this environment. Isolated star-disc encounters have previously been studied, and it was shown that very close encounters are necessary to completely destroy discs. However, relatively distant encounters are still able to change the disc size considerably.
Aims. We quantify the importance of disc-size reduction that is due to stellar encounters in an entire stellar population.
Methods. We modelled young, massive clusters of different densities using the code Nbody6 to determine the statistics of stellar encounter parameters. In a second step, we used these parameters to investigate the effect of the environments on the disc size. For this purpose, we performed a numerical experiment with an artificial initial disc size of 105 AU.
Results. We quantify to which degree the disc size is more sensitive to the cluster environment than to the disc mass or frequency. We show that in all investigated clusters a large portion of discs is significantly reduced in size. After 5 Myr, the fraction of discs smaller than 1000 AU in ONC-like clusters with an average number density of ̅ρcluster ~ 60pc-3, the fraction of discs smaller than 1000 AU is 65%, while discs smaller than 100 AU make up 15%. These fractions increase to 84% and 39% for discs in denser clusters like IC 348 (̅ρcluster ~ 500pc-3). Even in clusters with a density four times lower than in the ONC (̅ρcluster ~ 15pc-3), about 43% of all discs are reduced to sizes below 1000 AU and roughly 9% to sizes below 100 AU.
Conclusions. For any disc in the ONC that initially was larger than 1000 AU, the probability to be truncated to smaller disc sizes as a result of stellar encounters is quite high. Thus, among other effects, encounters are important in shaping discs and potentially forming planetary systems in stellar clusters.
Key words: protoplanetary disks / planets and satellites: formation / galaxies: star clusters: general
© ESO, 2015
1. Introduction
Most, if not all stars are initially surrounded by a protoplanetary disc from which a planetary system might eventually form. The observed sizes (=radii) of these discs span from a few 10 AU to several 100 AU, see Table 1 (Vicente & Alves 2005; Eisner et al. 2008; McCaughrean & O’dell 1996; Andrews & Williams 2007; Andrews et al. 2009, 2010). However, the majority of disc sizes has been found to be in the range of 100 − 200 AU. These discs disperse rapidly as a result of internal processes such as viscous torques (e.g. Shu et al. 1987), turbulent effects (Klahr & Bodenheimer 2003), and magnetic fields (Balbus & Hawley 2002). Observations of disc fractions in clusters show that the discs dissipate through internal processes on average at an age of ≤ 2.5 Myr. It is currently unclear whether this is valid for young stars in general (Pfalzner et al. 2014) and how certain absolute age estimates in clusters are (Bell et al. 2013).
Observed disc radii in different cluster environments.
There are additional environmental processes in a cluster that, depending on its stellar density, might lead to disc-mass loss, reduction in physical size, or even complete destruction. These processes are photoevaporation (see e.g. Johnstone et al. 1998; Störzer & Hollenbach 1999; Scally & Clarke 2002; Matsuyama et al. 2003; Johnstone et al. 2004; Adams et al. 2006; Alexander et al. 2006; Ercolano et al. 2008; Gorti & Hollenbach 2009; Drake et al. 2009) and stellar fly-bys or gravitational stripping (see e.g. Clarke & Pringle 1993; Scally & Clarke 2002; Pfalzner 2004; Adams et al. 2006; Olczak et al. 2006, 2010; Pfalzner & Olczak 2007; Craig & Krumholz 2013; Steinhausen & Pfalzner 2014; Rosotti et al. 2014).
From observations, the sizes of protoplanetary discs are usually determined by fitting the spectral energy distributions (SEDs) to disc models using a truncated power-law (Andrews & Williams 2007). If resolved images of the discs can be obtained, the disc size is identified as the radius at which the luminosity drops below a certain value (Vicente & Alves 2005; O’dell 1998). However, it is much more difficult to observationally constrain the disc size than the disc frequency or disc mass. Therefore, the disc sizes are only determined for a very limited number of stars. As a consequence, it is still a subject of debate whether the disc size is a function of the mass of the central star (compare e.g. Hillenbrand et al. 1998; Vicente & Alves 2005; Eisner et al. 2008). The disc frequencies in clusters of similar age (~1 Myr) reveal that the cluster environment influences the protoplanetary discs. The percentage of stars surrounded by discs decreases with increasing cluster peak density, dropping from 85% in NGC 2024 and 80% in the Orion nebula cluster (ONC) down to 40% in NGC 3603 (see also Table 2). Because the cluster ages are similar, the higher cluster density leads to a higher degree of disc destruction and thus to a lower disc frequency.
A number of theoretical investigations studying the influence of individual stellar encounters on protoplanetary discs have been performed in the past. For the case of an equal-mass encounter, Clarke & Pringle (1993) were the first to study the fate of disc matter after an interaction. They found that a coplanar, prograde encounter at a relative periastron distance of 1.25rperi material is removed from the disc down to 0.5rperi. But material is not only removed, it is also re-distributed within the disc, changing the (mass) surface density profile of the disc (Hall 1997). As the disc masses of individual stars are observationally better constrained than disc sizes, there has been a considerable amount of theoretical research on the influence of stellar encounters on the disc mass (e.g. Olczak et al. 2010; Steinhausen & Pfalzner 2014), but fewer studies of the disc size (e.g. Hall et al. 1996; Kobayashi & Ida 2001; Breslau et al. 2014). Nevertheless, the disc size is an important parameter because it defines the physical extent of the potentially forming planetary system.
The disc size after an encounter event was investigated for example by Kobayashi & Ida (2001). They found that the disc size after an equal-mass encounter is one-third of the periastron distance. Adams (2010) found a slightly different disc size of b/3 where b is the impact parameter, which is not necessarily equal to the periastron distance. Two other estimates for disc-size upper limits were introduced by de Juan Ovelar et al. (2012). They derived the disc size assuming that all material outside the Lagrangian point between the two stars is stripped from the disc. Furthermore, they suggested to convert the formula for disc-mass loss for parabolic, coplanar encounters reported by Olczak et al. (2006) directly into an upper limit for disc truncation, assuming a mass-density distribution within the disc of Σ = r-1. The few previous studies that considered disc sizes in stellar cluster environments (Adams et al. 2006; Malmberg et al. 2011; Pfalzner 2013) generalised, for lack of a universal description of disc sizes, the results obtained for equal-mass encounter by Kobayashi & Ida (2001) to non-equal mass encounters.
Recently, Breslau et al. (2014) showed that a generalisation of this one-third criterion postulated by Kobayashi & Ida (2001) is not advisable and that the outcome is very sensitive to the mass ratio of the two stars. They performed simulations of isolated star-disc encounters for a wide range of periastron distances and mass ratios, choosing the highest contrast in surface density to determine the disc sizes after the encounters. This is similar to the criterion used by observations, and the results by Breslau et al. (2014) can easily be applied to cluster simulations. They showed that encounters with large periastron distances and/or low mass ratios do not remove material from the disc but shift it inwards, reducing the disc size but not the mass. For disc-mass loss closer encounters and/or larger mass-ratios are needed. This finding demonstrated that the upper disc-size limits of de Juan Ovelar et al. (2012), which connect disc-size change directly to disc-mass loss, are thus too high by up to a factor of two.
Recently, Rosotti et al. (2014) investigated the effect of encounters on the disc-size distribution in an entire stellar cluster. They performed combined smoothed particle hydrodynamics (SPH)/N-body simulations of a low-mass cluster (100 stars) allowing hydrodynamical disc spreading. They found that while the masses of the discs are not much affected, the disc sizes are reduced by encounters within the ~0.5 Myr of cluster evolution.
Observed cluster properties.
Here, we wish to analyse numerically how encounters influence the disc size in clusters using a realistic initial mass function (IMF) and the therefore broad spectrum of encounter mass-ratios found in real clusters. We model clusters of different density to quantify the resulting disc-size dependence. Most importantly, in contrast to previous work, the effects of the encounters are modelled taking into account that the final disc size is very sensitive to the mass ratio of the two interacting stars. Although external photoevaporation might be as important as stellar encounters when describing disc sizes in clusters, we do not consider it in this work.
The simulations of the clusters with different densities as well as the disc-size definition are introduced in Sect. 2. The choice of initial disc sizes and the classification of encounters used throughout this work are also discussed there. The most important results are presented in Sect. 3, the assumptions applied and their influence on these results are detailed in Sect. 4. Our findings are briefly summarised in Sect. 5.
2. Method
We performed numerical simulations to investigate the influence of star-disc encounters on the disc size within stellar clusters of different densities. This was achieved by performing Nbody6 simulations (Aarseth 1973, 2003; Spurzem 1999) similar to those of Olczak et al. (2008, 2010), and Steinhausen & Pfalzner (2014). In those simulations, the stellar encounters in the clusters were tracked and their effect on protoplanetary discs was analysed in the diagnostics using a previously performed parameter study. In contrast to the previous work, we investigate the disc size rather than the disc mass or frequency in clusters. The disc sizes were obtained using the results from Breslau et al. (2014).
2.1. Cluster simulations
The dynamics of the stellar clusters was modelled by Nbody6 simulations taking the cluster density profile of the ONC as a prototype for a massive cluster in the solar neighbourhood. The ONC is the best observed massive cluster, rendering it possible to compare results of theoretical studies to observational data. It contains about 4000 stars, is ~ 1 Myr old, has a half-mass radius of roughly 1 pc (Hillenbrand & Hartmann 1998), and extends to ~ 2.5 pc (Hillenbrand & Hartmann 1998; Hillenbrand & Carpenter 2000). Lada et al. (2000) found that in the Trapezium, that is, in the inner 0.3 pc of the ONC, about 80 − 85% of the stars are surrounded by a protoplanetary disc, 60% of which having radii smaller than 50 AU (Vicente & Alves 2005).
Scally et al. (2005) found the density distribution in the ONC to differ from the isothermal approximation ρ0 ∝ r-2 in the inner 0.2 pc of the cluster. The surface density there is much flatter with Σ ∝ r-0.5. To obtain this flat profile after 1 Myr of simulation time, which is the assumed age of the ONC, Hillenbrand (1997) and Olczak et al. (2010), for instance, used the three-dimensional initial number density distribution ![Mathematical equation: \begin{equation} \rho_{0}(r) = \begin{cases} \rho_{0}\left(r/R_{{\rm 0.2}}\right)^{-2.3}, r \in \left(0, R_{{\rm 0.2}} \right] & \\ \rho_{0}\left(r/R_{{\rm 0.2}}\right)^{-2.0}, r \in \left(R_{{\rm 0.2}}, R \right] & \\ 0, r \in \left(R, \infty \right], & \\ \end{cases} \label{eq:density_distribution} \end{equation}](/articles/aa/full_html/2015/05/aa25552-14/aa25552-14-eq50.png) (1)with the radius R0.2 = 0.2 pc, the cluster radius R = 2.5 pc, and ρ0 = 3.1 × 10³ stars pc-3. After 1 Myr of cluster evolution this distribution represents today’s number density distribution of the ONC. The stellar positions, masses, and velocities were randomly attributed to the stars. All stars were assumed to be initially single and without any stellar evolution throughout the simulation. This is standard procedure to reduce the computational cost. Furthermore, the clusters were modelled without gas. The assumptions made and their influence on the outcome is discussed in Sect. 4 in detail.
(1)with the radius R0.2 = 0.2 pc, the cluster radius R = 2.5 pc, and ρ0 = 3.1 × 10³ stars pc-3. After 1 Myr of cluster evolution this distribution represents today’s number density distribution of the ONC. The stellar positions, masses, and velocities were randomly attributed to the stars. All stars were assumed to be initially single and without any stellar evolution throughout the simulation. This is standard procedure to reduce the computational cost. Furthermore, the clusters were modelled without gas. The assumptions made and their influence on the outcome is discussed in Sect. 4 in detail.
The stellar masses were sampled from the IMF by Kroupa (2002)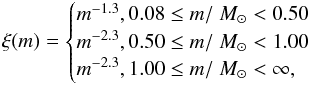 (2)with an upper mass limit of 150 M⊙ and randomly attributed to the stars in the cluster. We neglected the effect of initial mass segregation as proposed for the ONC for example by Bonnell & Davies (1998) and Olczak et al. (2011). Using an IMF is important, as the effect of unequal-mass encounters onto discs is stronger than for equal-mass encounters (Olczak et al. 2006; Moeckel & Bally 2007).
The clusters were set up to be initially in virial equilibrium:  , where Rhm is the half-mass radius, G the gravitational constant, M the total cluster mass, and σ the velocity dispersion. The latter was sampled adopting a Maxwellian distribution.
As we are interested in the effect of clusters of different densities on the disc-size distribution, we set up density-scaled versions of the ONC by keeping the radius fixed at 2.5 pc and varying the number of stars within the cluster. The resulting clusters with 1000, 2000, 8000, 16 000, and 32 000 stars have average number densities of roughly 1/4, 1/2, 2, 4, and 8 times the density of the ONC, respectively (see Table 3 for the exact number and mass densities).
For each of these clusters, a whole campaign of similar simulations with different random seeds was performed to minimise the effect of initial stellar properties on the encounter history and thus the protoplanetary discs. The numbers of simulations Nsim per model are given in Table 3. This approach renders it possible to obtain good statistics of encounters and the resulting changes in the disc size for environments of different densities.
Cluster model set-up.
In each simulation the encounter parameters for star-star interactions were recorded. In a diagnostic step, the disc sizes after each encounter were then calculated with these parameters, as described below in Sect. 2.2.
2.2. Encounter simulations
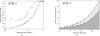 |
Fig. 1 a) Relative final disc size (asterisks) and disc mass (open squares) after an equal-mass encounter event (m12 = 1) as a function of the relative periastron distance rp = rperi/rprevious, with rperi periastron distance [AU] and rprevious disc size before the encounter [AU]. b) Parameter pairs (encounter mass ratio m12 and relative periastron distance rp) leading to 5% reduction in disc-size (asterisks) and disc mass (open squares). The light and dark grey areas depict the parameter space in which the disc size and mass are reduced. |
In the diagnostic step the influence of each tracked encounter on the size of the protoplanetary discs was determined. To do this, we used the results of the parameter study by Breslau et al. (2014). Since their study was limited to prograde coplanar parabolic (eccentricity=1) encounters, which are the most destructive, the resulting disc sizes should be regarded as lower limits compared to hyperbolic and/or inclined encounters. Breslau et al. (2014) covered the parameter space for of mass ratios and periastron distances typical for star-disc encounters in cluster environments: m12 = 0.3 − 500 and rp = 0.4 − 34, where m12 = m2/m1 is the ratio between the perturber mass (m2) and the mass of the disc-hosting star (m1) and rp = rperi/rprevious is the periastron distance rperi normalised to the disc size before the encounter rprevious.
In a diagnostic step, we analysed the cluster simulations described above, using their fit formula 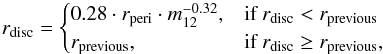 (3)with rperi being the periastron distance in AU, to calculate the disc size after each encounter in these clusters. As Eq. (3) shows, the resulting disc size is independent of the initial disc size as long as it is smaller than this initial value. It is basically the strongest encounter that determines the final disc size. At the beginning of the simulations, all disc sizes in the clusters were set to a universal value rinit (for details see Sect. 3.2). Most stars in a cluster undergo multiple encounters during the first few Myr. To take those multiple interactions of one and the same star with (different) other cluster members into account, the value of rprevious for the star’s ith encounter was set to the disc size resulting from the former (i − 1)th encounter (
 ). This is an approximation as the discs might be “hardened” by stellar fly-bys or have enough time to spread again between two encounters due to viscosity (see Sect. 4). The disc-size change due to multiple encounters needs to be investigated in more detail, taking all these effects into account.
Additionally, we assumed that every star in the clusters was initially surrounded by a thin disc of a given size. Although this results in disc-disc encounters, the stellar interactions were treated as star-disc encounters using Eq. (3). The resulting disc sizes are not expected to differ much from the sizes after disc-disc encounters. For a detailed discussion of the approximations above, see Sect. 4 and Breslau et al. (2014).
Before we present the results, we here clarify some definitions. The code Nbody6 that we used to simulate the clusters was extended to track the stellar encounters and store their properties. For every time step the star with the strongest gravitational influence on a primary star was identified and its orbit calculated, for additional restrictions and details see Olczak et al. (2012). Most such “encounters” are very distant and do not influence the sizes of discs at all. On the other hand, in extreme cases, stellar encounters cannot only alter the disc size, but destroy them completely. Here, the notion “disc-size-reducing encounter” is used for any encounter that (a) reduces the disc size by at least 5% relative to its previous disc size and (b) does not destroy the disc (rdisc> 10 AU). Consequences of this disc-size reduction limit are discussed in Sect. 4. By contrast, the first encounter that reduces the disc size by at least 5% relative to its previous size and that leads to a final disc size rdisc< 10 AU is denoted as “disc-destroying encounter”. Subsequent, potentially even stronger encounters are not considered in the analysis because the disc is already destroyed. For these very small discs, effects such as viscous accretion and internal photoevaporation may become important, but they were not considered in this work because of the computational effort. Therefore, all discs smaller than 10 AU are denoted “destroyed”. The term “strongest encounter” in this work describes the encounter with the strongest influence on the disc, which is not necessarily the closest encounter, because the encounter mass ratio is also factored in.
3. Results
Previous studies of protoplanetary discs mostly investigated the effect of star-disc encounters on the disc mass (e.g. Olczak et al. 2010; Steinhausen & Pfalzner 2014). Before studying this effect on the disc size in an entire star cluster, we first study the influence of a fly-by on a single star-disc system. Recently, Rosotti et al. (2014) noted in their simulations of stellar clusters that more discs are affected by disc truncation than disc-mass loss1. Here we wish to quantify this higher sensitivity of the disc size by systematically comparing it to disc-mass loss calculations. We used the results of Breslau et al. (2014) and Steinhausen et al. (2012) to obtain the disc sizes and masses after stellar encounters. In contrast to the disc size, the disc mass-loss strongly depends on the distribution of material in the disc. Here, we used a disc-mass distribution that follows a power-law: Σ ∝ r-1.
3.1. Sensitivity of disc properties
In Fig. 1a, the size (asterisks) and mass (open squares) of a disc after an encounter with an equal-mass perturber (m12 = 1) are shown as a function of the relative periastron distance rp = rperi/rprevious, where rperi is the periastron distance and rprevious the disc size before the encounter. The effect of an encounter on the size is much stronger than on the disc mass. For example, a close grazing encounter, equivalent to rp = 1, reduces the disc size to nearly a quarter of its previous size (28%), but it still retains more than half of its mass (57%).
This higher sensitivity of the disc size compared to the disc mass also holds true for encounter partners that differ in mass (m12 ≠ 1). The shaded areas in Fig. 1b depict the parameter space in which the encounters reduce the disc size (asterisks) and disc mass (open squares) by at least 5%. At any given mass ratio a reduction of the disc size by 5% is always achieved already with a much more distant encounter than is necessary for the same reduction in mass. And more importantly, a distant fly-by can affect the disc radius without any change of the disc mass2. In other words, our data show that, for example, an encounter leading to 5% disc-mass loss can reduce the disc size down to 60% of its previous value. This knowledge can now be used to quantify the sensitivity of the disc size compared to the disc mass in a whole cluster population.
3.2. Initial disc size
Most observed discs in clusters have sizes of 100 − 200 AU. However, a few protoplanetary discs with radii of a few 100 AU were found in the ONC as well. This indicates that a broad spectrum of sizes exists. It is unclear whether these observed disc sizes are representative for their initial state or whether they changed during the 1 − 2 Myr since their formation, nor do we know which role the environment played in this context. As a consequence, there is no information available about a natal or initial disc-size distribution within the ONC, for instance.
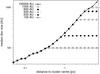 |
Fig. 2 Median disc size as a function of the distance to the cluster centre for model D2 with different initial disc sizes rinit: 100 AU (open triangles), 200 AU (filled circles), 500 AU (open circle), 800 AU (filled squares), 1000 AU (open squares), and 100 000 AU (asterisks). |
For this reason, we first investigated how the choice of an initial disc size affects the final disc-size distributions in a cluster. We started our investigation with the model cluster D2, which is representative for the ONC. All stars in this cluster were initially surrounded by discs of the same size rinit. This initial disc size was then varied from 100 AU to 100 000 AU. Although most encounters occur in the first Myr of cluster evolution (Pfalzner et al. 2006), the simulation time was chosen to be 5 Myr to ensure that all relevant encounters are accounted for.
To obtain an overview of the disc-size distribution in the cluster, the median disc sizes in different radial bins of the cluster were determined. Note that these median disc sizes were determined for each distance-bin separately, not in a cumulative way. Figure 2 shows these median disc sizes for different initial disc sizes – 100 AU (open triangles), 200 AU (filled circles), 500 AU (open circle), 800 AU (filled squares), 1000 AU (open squares), and 100 000 AU (asterisks).
Near the cluster centre the median disc sizes are significantly smaller than in the cluster outskirts. For example, for an initial disc size of 500 AU, the median disc size at the rim of the cluster core (< 0.3 pc) is < 100 AU, but farther out at 2 pc it is more than five times as large (~ 500 AU). This trend might be expected because the density is much higher in the inner parts of the clusters. Thus, more encounters occur there and more discs are reduced in size. Furthermore, the encounters in the inner cluster regions are on average closer, that is, they have lower periastrons (see e.g. Scally & Clarke 2001), which is due to the higher density. Therefore, the discs are smaller than in the less dense cluster outskirts.
Overall, if the discs in the ONC were initially larger than 100 AU they are significantly reduced in size by stellar encounters, especially in the cluster core (< 0.3 pc). Any initial disc size rinit> 100 AU leads to the same median disc size distribution in the cluster core. In addition, an initial disc size > 1000 AU was assumed; the final median disc size distribution in the cluster is the same up to a distance of ~ 4 pc, which in the case of the ONC would be the entire cluster (Rcluster = 2.5 pc). This finding was then used to set up discs in the different cluster types to study their influence on the disc-size distribution.
3.3. Numerical experiment
Building on this finding that the median final disc size in a cluster is largely independent of the initial disc size, we performed a numerical experiment to be able to separate processed from unprocessed discs. The initial disc sizes in each cluster were set to rinit = 100 000 AU (asterisks in Fig. 2). Although this is not a realistic scenario, it allowed us to determine the relevance of encounters in the cluster environments.
This numerical experiment is applied to clusters of different average densities, ranging from 15 pc-3 (model D0) to ~ 500 pc-3 (model D5). For the densities of the other models, see Table 3. The cluster model D2 was denoted ONC model because after 1 Myr of cluster evolution it was representative for today’s ONC, see Sect. 2.1. Discs that were destroyed (rdisc< 10 AU) were excluded from the data set and treated separately. If not indicated otherwise, the outcome of the cluster simulations after 5 Myr of evolution is shown.
3.3.1. Disc-size distributions
As a first step, we quantified the amount of discs that are influenced by encounters in the different cluster environments. Figure 3 shows the fraction of stars that undergo at least one disc-size reducing encounter (solid line, filled circles) as a function of the average cluster number density. The fraction of stars with disc-size-reducing encounters increases, as expected, with cluster density. In the least dense clusters, some stars do not undergo any encounter at all or only very weak ones, that is, low mass ratios and high periastrons. Here the fraction of stars with disc-size-reducing encounters is ~ 65%. By contrast, in the densest cluster, stellar encounters are very frequent and stronger, that is, high mass ratios and/or lower periastrons. In this cluster type, nearly all stars (~ 90%) undergo at least one disc-size reducing encounter.
The initial size of the discs was set to 100 000 AU, thus, after the first disc-size-reducing encounter it might still be as large as 95 000 AU. But most encounters reduce the discs to much lower values and most discs undergo several disc-size-reducing encounters in the 5 Myr of cluster development. Consequently, two questions arise: i) what is the final disc-size distribution? and ii) how many discs are destroyed? The dashed and dashed-dotted lines with filled circles in Fig. 3 depict the fractions of discs with a final size smaller than 1000 AU and 100 AU (see also Table 4). The fraction of stars with discs smaller than 1000 AU nearly doubles from low-density clusters (43%) to high-density clusters (84%). Nevertheless, even in environments with densities of 15 pc-3, stellar encounters significantly reduce the sizes of discs. The slope of the curve flattens towards the high-density cluster end, see Fig. 3. This flattening can be explained by studying the fraction of destroyed discs3 (dotted line, open circles). It amounts to ~ 9% in model D5, which means that in this case, nearly all discs (97%) are either influenced by a disc-size-reducing encounter or are destroyed. This is near saturation, which is the reason for the flattening of the slope. Furthermore, the fraction of disc-destroying encounters triples from ~ 3% in model D0 to ~ 9% in model D5 (see Table 4), whereas the whole discs < 1000 AU only double. This additionally limits the fraction of discs smaller than 1000 AU.
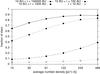 |
Fig. 3 Fraction of stars with destroyed discs (open circles) and whole discs (filled circles) as a function of the average cluster density. Depicted are discs smaller than 100 000 AU (solid line), smaller than 1000 AU (dashed line), and smaller than 100 AU (dashed-dotted line) after 5 Myr. |
The fraction of stars with final disc sizes < 100 AU also increases with cluster density (dashed-dotted line). In the high-density cluster model it is four times higher than in the low-density model, ~ 40% and ~ 10%. In this case, only 19% of all discs in model D5 are either reduced to sizes < 100 AU or destroyed, so there is no flattening of the slope due to near saturation. The fraction of discs < 100 AU increases much more strongly with cluster density than the fraction of discs < 1000 AU. For example, in the least dense cluster the ratio between discs smaller than 1000 AU and discs smaller than 100 AU is roughly 5:1, whereas for the densest cluster it increases to nearly 2:1. The reason is that the increasing cluster density leads to closer encounters that in turn reduce many more discs to smaller sizes. Summarising, the final disc size distribution and the fraction of destroyed discs strongly depends on the average cluster number density.
3.3.2. Distance to the cluster centre
Fractions of discs influenced by encounters.
We have shown that the final disc sizes strongly depend on the average number density of their cluster environment. Each of these clusters was set up with a density profile according to Eq. (1), so they are much denser in the inner regions than in the outskirts. Therefore, the disc sizes should also be a function of the position of the disc-hosting star in the cluster. In Fig. 4 we compare the median disc sizes as a function of the star’s final (after 5 Myr) distance to the cluster centre in the different clusters. For comparison, the line with asterisks is the same as in Fig. 2.
As expected, the median final disc size increases with the distance to the cluster centre for all average cluster densities. Stars that are finally located at a distance of 0.3 pc from the cluster centre have a median disc size of about 200 AU in the sparsest cluster (D0, open squares), whereas in the cluster outskirts it is much larger, for instance ~ 2400 AU at a distance of 3 pc. For the densest clusters model D5, the median disc sizes are much smaller as a result of the elevated rate of close encounters, as described before, but the dependence on the host star position in the cluster is the same. At 0.3 pc the median disc size is about 20 AU, whereas at 3 pc it is ~ 300 AU (open triangles).
To obtain the variation of disc sizes in the clusters, the shaded area in Fig. 4 depicts the disc-size range for 50% of all stars in the ONC model that have disc sizes of about the median size (asterisks). For example, half of the stars with final distances of 0.3 pc to the cluster centre, which represents the border of the Trapezium in the ONC, have discs with sizes of 40 − 200 AU. The median disc size at this distance is 100 AU. At the cluster radius of the ONC (2.5 pc), half of all discs have sizes between 300 − 1300 AU, the median disc size is 630 AU. This means that half of the stars in the ONC model have disc sizes that vary by about a factor of two about the median, but which are still much smaller than the initial disc size of 100 000 AU. The final disc size is a function of the host star position in the cluster, or in other words, not only of the global average cluster density, but also of the local density of its environment.
3.3.3. Disc sizes for different stellar types
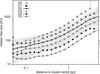 |
Fig. 4 Median disc size in clusters of different densities (rising from D0, open squares, to D5, open triangles) for different distances of the disc-hosting star to the cluster centre (bins). The line with asterisks indicates the ONC model, with the grey area containing 50% of all stars with disc sizes around the median disc size. For explanations, see text. |
As mentioned in Sect. 1, it is still a subject of debate whether the disc size is a function of the stellar mass. We investigated whether encounter-induced disc-size reduction might be responsible for this potential dependency. Figure 5 shows the median disc size as a function of stellar mass and spectral type. For clarity, only the results for models D0 (open squares), D2 (asterisks), and D5 (open triangles) are shown.
The median disc size does indeed depend on the stellar mass. For M- to B-type stars in the ONC model, the median disc size increases by roughly a factor of two, from 420 AU to 880 AU. Around O-stars the discs are smaller than around all other star types with a median size of 270 AU. The same trend in median disc sizes can be found for models of lower density (e.g. model D0 in Fig. 5). The smaller sizes of discs around O-stars in models D0 and D2 can be explained by the encounter frequency, which as a function of the relative perturber mass has two peaks (see Fig. 4 of Olczak et al. 2010). One peak lies at low mass-ratios, the other one at high mass-ratios. For model D0 the high-mass stars dominate the encounter history because of gravitational focusing. Therefore, the difference between the median disc sizes of M-stars and O-stars is largest in this model.
In contrast, in model D5 the median disc size of O-stars (130 AU) is slightly larger than the one of M-stars (~ 90 AU). In this cluster type, the low-mass stars dominate the encounter history so that M-stars have slightly smaller discs than all other star types – including O-stars. The ONC model D2 represents a turning point: the most massive and least massive stars are equally important as encounter partners. Thus, the absolute difference between the discs around M-stars and O-stars is smaller than in model D0.
All cluster models were set up without primordial mass segregation. Nevertheless, in the 5 Myr of cluster evolution, dynamical mass segregation might occur. The final positions of the B- and O-stars showed no mass segregation in the low-density clusters and only weak mass segregation in the densest models. Therefore, the impact of gravitational focusing on the disc size – especially in the low-density clusters – is most probably stronger than the effect of dynamical mass segregation.
4. Discussion and conclusion
Our simulations include several assumptions. Their influence on the results is discussed below.
Most stellar clusters show signs of mass segregation, but whether this is the case for the ONC is still under debate, cf. Bonnell & Davies (1998), Olczak et al. (2011), Huff & Stahler (2006). It is currently unclear whether clusters are primordially mass-segregated or not. Here we did not take into account any primordial mass segregation, only dynamical mass segregation during the simulation. This was done for simplicity because we aimed to study clusters of different densities and their influence on disc sizes. Primordial mass segregation would have increased the initial cluster-core density and altered the encounter frequency. Primordial mass segregation affects this type of clusters in two ways: i) the most massive stars undergo many more encounters as a result of their location in the dense cluster centre, and therefore the disc sizes are smaller around O-stars than in the case without mass-segregation; ii) the stronger gravitational focusing increases the number of encounters. This leads to a somewhat lower disc frequency and smaller disc sizes, mainly around the O-stars.
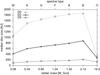 |
Fig. 5 Median disc size in cluster models D0 (open squares), D2 (asterisks), and D5 (open triangles) as a function of the stellar mass [M⊙] and spectral type. |
All stars in the clusters were assumed to be initially single, neglecting primordial binaries. If these were included, more discs would be truncated to a smaller size or even destroyed by the binary stars, especially for very close binaries. Köhler et al. (2006) found that the binary frequency in the ONC is higher for stars with masses > 2 M⊙ than for low-mass stars. Generally, the binary frequency increases with stellar mass, see Duchêne & Kraus (2013). In our simulations, primordial binaries would therefore lead to even smaller discs for B- and O-stars than anticipated in Fig. 5.
The cluster models investigated are representative for young, massive clusters that are still embedded in their natal gas. In the solar neighbourhood the star formation efficiency is relatively low (30%) and the gas expulsion drives the expansion of the cluster, while at the same time a large portion of its stars becomes unbound (Pfalzner & Kaczmarek 2013). Observations of stellar clusters indicate that after 1 − 3 Myr the gas is expelled from the cluster and thus the star-formation process ends. We did not consider the effect of gas expulsion. In a follow-up paper, this case of cluster dynamics will be studied in detail.
We chose an artificially large initial disc of 100 000 AU around every star to determine the relevance of encounters in a cluster environment. Such discs are not physical, but have to be seen as part of the performed numerical experiment. The resulting median disc sizes can thus not represent any real distribution as found in the ONC, for example, but rather give a first estimate of the influence of encounters on discs after 5 Myr of evolution, especially when considering that other effects are neglected (see below). The surprisingly good match to the observed data shows that the process of disc-size reduction that is due to stellar encounters is indeed important and should not be neglected. The largest discs in the ONC could have formed even larger and already have been pruned to their current size by dynamical interactions.
All encounters in the clusters were assumed to be prograde, coplanar, and parabolic (eccentricity =1). These are the most destructive encounters (Clarke & Pringle 1993; Pfalzner et al. 2005b). Especially in very dense clusters, a large portion of encounters can have eccentricities > 1. Such eccentric orbits are less efficient in removing disc mass (Olczak et al. 2010). In addition, inclined encounters are common in cluster environments. Coplanar encounters lead to smaller disc sizes than their inclined counterparts. Therefore, the cases of parabolic coplanar encounters should be regarded as lower limits (Breslau, in prep.).
There are other effects that might influence the disc size. First, we used the formula of Breslau et al. (2014) to describe star-disc encounters. It might have been more appropriate to investigate disc-disc encounters. However, it was shown by Pfalzner et al. (2005a) that in disc-disc encounters between low-mass discs (0.01 M⊙) material is exchanged, but it is mainly transferred to the inner disc regions. Since the disc size is determined using the steepest point in the outer slope of the disc density distribution, this captured disc material is not expected to alter the final size much.
Second, it has been suggested that photoevaporation might be an important mechanism to shrink or completely destroy discs (see e.g. Störzer & Hollenbach 1999; Scally & Clarke 2002; Johnstone et al. 2004; Adams et al. 2006; Alexander et al. 2006; Ercolano et al. 2008; Gorti & Hollenbach 2009; Drake et al. 2009). However, we modelled stellar clusters in the embedded phase, during which stage the presence of the natal gas is expected to reduce the effect of photoevaporation. If photoevaporation nevertheless played a role, the presented disc sizes would be even smaller for stars close to the most massive stars, especially near the cluster core.
Third, the discs were modelled consisting of mass-less tracer particles and hydrodynamical effects were excluded, for an in-depth discussion see Breslau et al. (2014). Rosotti et al. (2014) found that the hydrodynamical evolution of the discs is important for high viscosity. In this case, the discs spread quite rapidly after an encounter and compensate for the size reduction that is due to encounters. In the case of low viscosity, it was the closest encounter alone that determined the final disc size. The encounters were particularly important in the dense central cluster areas. We did not include viscous disc spreading in our simulations. If we had considered this effect, the discs that already underwent their strongest encounter (high mass ratio and/or small periastron distance) would have been most affected by changes due to disc spreading. If the disc had had time to expand again, the final disc size after a subsequent relatively strong encounter would have been larger than presented here. To study this effect in more detail, the next natural step would be to include viscous spreading in our type of simulations.
As a result of its sensitivity, the disc size is a suitable tool for quantifying the influence of the stellar environment. One indication that this might be the case comes from the observations by Vicente & Alves (2005). They found that roughly 60% of the Trapezium stars (< 0.3 pc) have discs smaller than 50 AU. Our simulations indicate that for model D2 (ONC), the median disc size of all stars in the cluster core (< 0.3 pc) is roughly 80 AU. This fits the observed values remarkably well, especially when considering that our simulations only take into account stellar encounters as a source of disc-size influence. They play an important role in terms of disc-sizes but should be taken together with the other effects discussed above (photoevaporation, viscous disc-spreading, etc.) to reproduce the actual disc-size distributions as found in stellar clusters today.
The protoplanetary discs may eventually form planetary systems. Their potential physical extent, as shown above, is defined to a high degree by the birth environment. The influence of a stellar cluster on already formed planetary systems has been studied theoretically in the past (e.g. Craig & Krumholz 2013; Malmberg et al. 2011). Craig & Krumholz (2013) found that in dispersing, substructured clusters planets close to their host stars (few tens of AU distance) are not perturbed by stellar flybys. Compared to the spherical clusters modelled here, the substructures lead to regions of enhanced stellar density and thus to a higher encounter frequency in certain areas of the cluster. These substructures dissolve in most cases at the latest when the whole cluster disperses. When the substructures are taken as regions of (transiently) enhanced stellar density, our results support their findings, as only a few per cent of discs are completely destroyed (< 10 AU), while most discs are finally larger than a few tens of AU, see Fig. 3.
5. Summary
We investigated the influence of the cluster environment on the disc size. Combining Nbody simulations of clusters of different densities with simulations of protoplanetary discs after star-disc encounters, we found that unlike the disc mass, the disc size can already be changed by relatively distant encounters. We performed a numerical experiment, choosing a very large initial disc size around each star. The results show that encounters are capable of reducing disc sizes of most stars to values < 1000 AU in all investigated clusters. The resulting sizes agree well with typical disc sizes found by observations in the ONC today, for example. It might be that the cluster environment rather than the initial size determines the final extent of a protoplanetary disc in many cases.
They used a disc-mass density distribution according to Σ ∝ r2/3.
The disc-mass change is also less sensitive than the angular momentum change, see Olczak et al. (2006), Pfalzner & Olczak (2007), Steinhausen et al. (2012).
A detailed description of the properties of the disc-destroying encounters can be found in the appendix.
References
- Aarseth, S. J. 1973, Vistas in Astronomy, 15, 13 [NASA ADS] [CrossRef] [Google Scholar]
- Aarseth, S. J. 2003, Gravitational N-Body Simulations (Cambridge, UK: Cambridge University Press), 430 [Google Scholar]
- Adams, F. C. 2010, ARA&A, 48, 47 [NASA ADS] [CrossRef] [Google Scholar]
- Adams, F. C., Proszkow, E. M., Fatuzzo, M., & Myers, P. C. 2006, ApJ, 641, 504 [NASA ADS] [CrossRef] [Google Scholar]
- Alexander, R. D., Clarke, C. J., & Pringle, J. E. 2006, MNRAS, 369, 229 [NASA ADS] [CrossRef] [Google Scholar]
- Andrews, S. M., & Williams, J. P. 2007, ApJ, 659, 705 [NASA ADS] [CrossRef] [Google Scholar]
- Andrews, S. M., Wilner, D. J., Hughes, A. M., Qi, C., & Dullemond, C. P. 2009, ApJ, 700, 1502 [NASA ADS] [CrossRef] [Google Scholar]
- Andrews, S. M., Wilner, D. J., Hughes, A. M., Qi, C., & Dullemond, C. P. 2010, ApJ, 723, 1241 [NASA ADS] [CrossRef] [Google Scholar]
- Balbus, S. A., & Hawley, J. F. 2002, ApJ, 573, 749 [NASA ADS] [CrossRef] [Google Scholar]
- Bell, C. P. M., Naylor, T., Mayne, N. J., Jeffries, R. D., & Littlefair, S. P. 2013, MNRAS, 434, 806 [NASA ADS] [CrossRef] [Google Scholar]
- Bonnell, I. A., & Davies, M. B. 1998, MNRAS, 295, 691 [NASA ADS] [CrossRef] [Google Scholar]
- Breslau, A., Steinhausen, M., Vincke, K., & Pfalzner, S. 2014, A&A, 565, A130 [NASA ADS] [CrossRef] [EDP Sciences] [Google Scholar]
- Brinch, C., & Jørgensen, J. K. 2013, A&A, 559, A82 [NASA ADS] [CrossRef] [EDP Sciences] [Google Scholar]
- Clarke, C. J., & Pringle, J. E. 1993, MNRAS, 261, 190 [NASA ADS] [CrossRef] [Google Scholar]
- Craig, J., & Krumholz, M. R. 2013, ApJ, 769, 150 [NASA ADS] [CrossRef] [Google Scholar]
- de Juan Ovelar, M., Kruijssen, J. M. D., Bressert, E., et al. 2012, A&A, 546, L1 [NASA ADS] [CrossRef] [EDP Sciences] [Google Scholar]
- Drake, J. J., Ercolano, B., Flaccomio, E., & Micela, G. 2009, ApJ, 699, L35 [NASA ADS] [CrossRef] [Google Scholar]
- Duchêne, G., & Kraus, A. 2013, ARA&A, 51, 269 [Google Scholar]
- Eisner, J. A., Plambeck, R. L., Carpenter, J. M., et al. 2008, ApJ, 683, 304 [NASA ADS] [CrossRef] [Google Scholar]
- Ercolano, B., Drake, J. J., Raymond, J. C., & Clarke, C. C. 2008, ApJ, 688, 398 [NASA ADS] [CrossRef] [Google Scholar]
- Gorti, U., & Hollenbach, D. 2009, ApJ, 690, 1539 [Google Scholar]
- Haisch, Jr., K. E., Lada, E. A., & Lada, C. J. 2000, AJ, 120, 1396 [NASA ADS] [CrossRef] [Google Scholar]
- Hall, S. M. 1997, MNRAS, 287, 148 [NASA ADS] [CrossRef] [Google Scholar]
- Hall, S. M., Clarke, C. J., & Pringle, J. E. 1996, MNRAS, 278, 303 [NASA ADS] [Google Scholar]
- Harayama, Y., Eisenhauer, F., & Martins, F. 2008, ApJ, 675, 1319 [NASA ADS] [CrossRef] [Google Scholar]
- Harsono, D., Jørgensen, J. K., van Dishoeck, E. F., et al. 2014, A&A, 562, A77 [NASA ADS] [CrossRef] [EDP Sciences] [Google Scholar]
- Hillenbrand, L. A. 1997, AJ, 113, 1733 [NASA ADS] [CrossRef] [Google Scholar]
- Hillenbrand, L. A., & Carpenter, J. M. 2000, ApJ, 540, 236 [NASA ADS] [CrossRef] [Google Scholar]
- Hillenbrand, L. A., & Hartmann, L. W. 1998, ApJ, 492, 540 [NASA ADS] [CrossRef] [Google Scholar]
- Hillenbrand, L. A., Strom, S. E., Calvet, N., et al. 1998, AJ, 116, 1816 [NASA ADS] [CrossRef] [Google Scholar]
- Huff, E. M., & Stahler, S. W. 2006, ApJ, 644, 355 [NASA ADS] [CrossRef] [Google Scholar]
- Johnstone, D., Hollenbach, D., & Bally, J. 1998, ApJ, 499, 758 [NASA ADS] [CrossRef] [Google Scholar]
- Johnstone, D., Matsuyama, I., McCarthy, I. G., & Font, A. S. 2004, in Rev. Mex. Astron. Astrofis. Conf. Ser., 22, eds. G. Garcia-Segura, G. Tenorio-Tagle, J. Franco, & H. W. Yorke, 38 [Google Scholar]
- Klahr, H. H., & Bodenheimer, P. 2003, ApJ, 582, 869 [NASA ADS] [CrossRef] [Google Scholar]
- Kobayashi, H., & Ida, S. 2001, Icarus, 153, 416 [NASA ADS] [CrossRef] [Google Scholar]
- Köhler, R., Petr-Gotzens, M. G., McCaughrean, M. J., et al. 2006, A&A, 458, 461 [NASA ADS] [CrossRef] [EDP Sciences] [Google Scholar]
- Kroupa, P. 2002, Science, 295, 82 [NASA ADS] [CrossRef] [PubMed] [Google Scholar]
- Lada, E. A., Depoy, D. L., II, N. J., & Gatley, I. 1991, ApJ, 371, 171 [NASA ADS] [CrossRef] [Google Scholar]
- Lada, C. J., Muench, A. A., Haisch, Jr., K. E., et al. 2000, AJ, 120, 3162 [NASA ADS] [CrossRef] [Google Scholar]
- Malmberg, D., Davies, M. B., & Heggie, D. C. 2011, MNRAS, 411, 859 [NASA ADS] [CrossRef] [Google Scholar]
- Matsuyama, I., Johnstone, D., & Hartmann, L. 2003, ApJ, 582, 893 [NASA ADS] [CrossRef] [Google Scholar]
- McCaughrean, M. J., & O’dell, C. R. 1996, AJ, 111, 1977 [NASA ADS] [CrossRef] [Google Scholar]
- McCaughrean, M. J., & Stauffer, J. R. 1994, AJ, 108, 1382 [NASA ADS] [CrossRef] [Google Scholar]
- Moeckel, N., & Bally, J. 2007, ApJ, 656, 275 [NASA ADS] [CrossRef] [Google Scholar]
- O’dell, C. R. 1998, AJ, 115, 263 [NASA ADS] [CrossRef] [Google Scholar]
- Olczak, C., Pfalzner, S., & Spurzem, R. 2006, ApJ, 642, 1140 [NASA ADS] [CrossRef] [Google Scholar]
- Olczak, C., Pfalzner, S., & Eckart, A. 2008, A&A, 488, 191 [NASA ADS] [CrossRef] [EDP Sciences] [Google Scholar]
- Olczak, C., Pfalzner, S., & Eckart, A. 2010, A&A, 509, A63 [NASA ADS] [CrossRef] [EDP Sciences] [Google Scholar]
- Olczak, C., Spurzem, R., & Henning, T. 2011, A&A, 532, A119 [NASA ADS] [CrossRef] [EDP Sciences] [Google Scholar]
- Olczak, C., Kaczmarek, T., Harfst, S., Pfalzner, S., & Portegies Zwart, S. 2012, ApJ, 756, 123 [NASA ADS] [CrossRef] [Google Scholar]
- Pfalzner, S. 2004, ApJ, 602, 356 [NASA ADS] [CrossRef] [Google Scholar]
- Pfalzner, S. 2013, A&A, 549, A82 [NASA ADS] [CrossRef] [EDP Sciences] [Google Scholar]
- Pfalzner, S., & Kaczmarek, T. 2013, A&A, 559, A38 [NASA ADS] [CrossRef] [EDP Sciences] [Google Scholar]
- Pfalzner, S., & Olczak, C. 2007, A&A, 462, 193 [NASA ADS] [CrossRef] [EDP Sciences] [Google Scholar]
- Pfalzner, S., Umbreit, S., & Henning, T. 2005a, ApJ, 629, 526 [NASA ADS] [CrossRef] [Google Scholar]
- Pfalzner, S., Vogel, P., Scharwächter, J., & Olczak, C. 2005b, A&A, 437, 967 [NASA ADS] [CrossRef] [EDP Sciences] [Google Scholar]
- Pfalzner, S., Olczak, C., & Eckart, A. 2006, A&A, 454, 811 [NASA ADS] [CrossRef] [EDP Sciences] [Google Scholar]
- Pfalzner, S., Steinhausen, M., & Menten, K. 2014, ApJ, 793, L34 [NASA ADS] [CrossRef] [Google Scholar]
- Rosotti, G. P., Dale, J. E., de Juan Ovelar, M., et al. 2014, MNRAS, 441, 2094 [NASA ADS] [CrossRef] [Google Scholar]
- Scally, A., & Clarke, C. 2001, MNRAS, 325, 449 [Google Scholar]
- Scally, A., & Clarke, C. 2002, MNRAS, 334, 156 [NASA ADS] [CrossRef] [Google Scholar]
- Scally, A., Clarke, C., & McCaughrean, M. J. 2005, MNRAS, 358, 742 [NASA ADS] [CrossRef] [Google Scholar]
- Shu, F. H., Adams, F. C., & Lizano, S. 1987, ARA&A, 25, 23 [Google Scholar]
- Spurzem, R. 1999, J. Comput. Appl. Math., 109, 407 [NASA ADS] [CrossRef] [Google Scholar]
- Steinhausen, M., & Pfalzner, S. 2014, A&A, 565, A32 [NASA ADS] [CrossRef] [EDP Sciences] [Google Scholar]
- Steinhausen, M., Olczak, C., & Pfalzner, S. 2012, A&A, 538, A10 [NASA ADS] [CrossRef] [EDP Sciences] [Google Scholar]
- Stolte, A., Brandner, W., Brandl, B., Zinnecker, H., & Grebel, E. K. 2004, AJ, 128, 765 [NASA ADS] [CrossRef] [Google Scholar]
- Störzer, H., & Hollenbach, D. 1999, ApJ, 515, 669 [CrossRef] [Google Scholar]
- Vicente, S. M., & Alves, J. 2005, A&A, 441, 195 [NASA ADS] [CrossRef] [EDP Sciences] [Google Scholar]
Appendix A: Properties of disc-destroying encounters
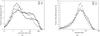 |
Fig. A.1 a) Fraction of disc-destroying encounters as function of the mass ratio and b) fraction of disc-destroying encounters as function of the periastron distance for cluster models D0 (open squares), D2 (asterisks), and D5 (open triangles). |
Figure A.1a shows the fraction of disc-destroying encounters as a function of the encounter mass ratio for three cluster models (D0, D2, D5). For the densest cluster model (D5, open triangles), the encounter mass-ratio distribution has two peaks: one at low mass ratios (m12 = 3) and a second smaller peak at very high mass ratios (m12 = 250). So the disc-destroying encounters most probably have quite low mass ratios in this environment. This is in accordance with the results of Olczak et al. (2010). They found that in clusters of higher density than the ONC the low-mass stars dominate the encounter history, leading to lower encounter mass ratios. They stated that the ONC itself is a turning point, low-mass and high-mass stars similarly contribute to the encounter history. This is reflected in the encounter mass-ratio distribution for the ONC model (asterisks), which is flat and does not show any sign of a preferred mass ratio for disc-destroying encounters. For the least dense cluster model (D0, open squares), one would expect, based on the work of Olczak et al. (2010), that high mass-ratio encounters should be largely responsible for disc destruction, as the most massive stars undergo many encounters due to gravitational focusing. But this is not the case, as Fig. A.1a shows. The distribution of disc-destroying encounters has a very broad peak at low mass ratios. This might be due to the mass sampling in this work: the masses were randomly sampled from an IMF (see Sect. 2) so it is more probable to obtain very massive stars in clusters with higher membership. In low-mass clusters the most massive star is – on average – less massive than in the high-mass cluster.
Figure A.1b shows the fraction of disc-destroying encounters as a function of their periastron distance for the same cluster models as above (D0, D2, D5). For all cluster types most disc-destroying encounters typically have distances of about 30 − 40 AU. The distribution for model D2 is slightly broader than those of the other cluster models. The disc size is determined by both the periastron distance and the mass ratio (see Eq. (3)), thus, this is in accordance with the broad spectrum of mass ratios for the disc-destroying encounters in Fig. A.1a. If the mass ratio is low, the encounter has to be closer, meaning that the periastron distance needs to be smaller, to destroy a disc than is necessary in a high mass-ratio case.
Appendix B: Location of disc-destroying encounters
The larger part of discs is influenced by their stellar encounters (65 − 89%, see Table 4), but is not destroyed. As already mentioned in Sect. 3.3.1, in the sparsest cluster, about 3% of the discs are destroyed after 5 Myr; for the densest cluster this fraction increases to ~ 9%. This means that the fraction of destroyed discs increases with increasing average cluster density. Analogously to the analysis in Sect. 3.3.2, we can now determine whether the disc-destroying encounters are also a function of the star’s position in the cluster, or in other words, a function of the local density.
Figure B.1 shows the position of the disc-hosting stars at the time of the encounter for three different cluster models (D0, open squares, D2, asterisks, and D5, open triangles). For the least dense cluster, most disc-destroying encounters take place at a distance of 0.1 − 0.2 pc from the cluster centre. In the case of the ONC model cluster (D2, asterisks) the whole curve is shifted towards lower distances. As the cluster is much denser than model D0, more destructive encounters occur at such small distances from the cluster centre. For the densest cluster model (D5, open triangles), the distribution is entirely different. In this cluster type, the encounters are dominated by low-mass stars, in contrast to the low-density clusters where the most massive stars dominate the encounter history (Olczak et al. 2010). As a result, the distribution of locations is much shallower and peaks only in the most inner part of the cluster (~ 0.01 pc).
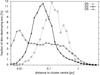 |
Fig. B.1 Fraction of disc-destroying encounters as function of distance to the cluster centre where they took place for cluster models D0 (open squares), D2 (asterisks), and D5 (open triangles). |
All Tables
All Figures
|
Fig. 1 a) Relative final disc size (asterisks) and disc mass (open squares) after an equal-mass encounter event (m12 = 1) as a function of the relative periastron distance rp = rperi/rprevious, with rperi periastron distance [AU] and rprevious disc size before the encounter [AU]. b) Parameter pairs (encounter mass ratio m12 and relative periastron distance rp) leading to 5% reduction in disc-size (asterisks) and disc mass (open squares). The light and dark grey areas depict the parameter space in which the disc size and mass are reduced. |
| In the text | |
|
Fig. 2 Median disc size as a function of the distance to the cluster centre for model D2 with different initial disc sizes rinit: 100 AU (open triangles), 200 AU (filled circles), 500 AU (open circle), 800 AU (filled squares), 1000 AU (open squares), and 100 000 AU (asterisks). |
| In the text | |
|
Fig. 3 Fraction of stars with destroyed discs (open circles) and whole discs (filled circles) as a function of the average cluster density. Depicted are discs smaller than 100 000 AU (solid line), smaller than 1000 AU (dashed line), and smaller than 100 AU (dashed-dotted line) after 5 Myr. |
| In the text | |
|
Fig. 4 Median disc size in clusters of different densities (rising from D0, open squares, to D5, open triangles) for different distances of the disc-hosting star to the cluster centre (bins). The line with asterisks indicates the ONC model, with the grey area containing 50% of all stars with disc sizes around the median disc size. For explanations, see text. |
| In the text | |
|
Fig. 5 Median disc size in cluster models D0 (open squares), D2 (asterisks), and D5 (open triangles) as a function of the stellar mass [M⊙] and spectral type. |
| In the text | |
|
Fig. A.1 a) Fraction of disc-destroying encounters as function of the mass ratio and b) fraction of disc-destroying encounters as function of the periastron distance for cluster models D0 (open squares), D2 (asterisks), and D5 (open triangles). |
| In the text | |
|
Fig. B.1 Fraction of disc-destroying encounters as function of distance to the cluster centre where they took place for cluster models D0 (open squares), D2 (asterisks), and D5 (open triangles). |
| In the text | |
Current usage metrics show cumulative count of Article Views (full-text article views including HTML views, PDF and ePub downloads, according to the available data) and Abstracts Views on Vision4Press platform.
Data correspond to usage on the plateform after 2015. The current usage metrics is available 48-96 hours after online publication and is updated daily on week days.
Initial download of the metrics may take a while.