Fig. A.1
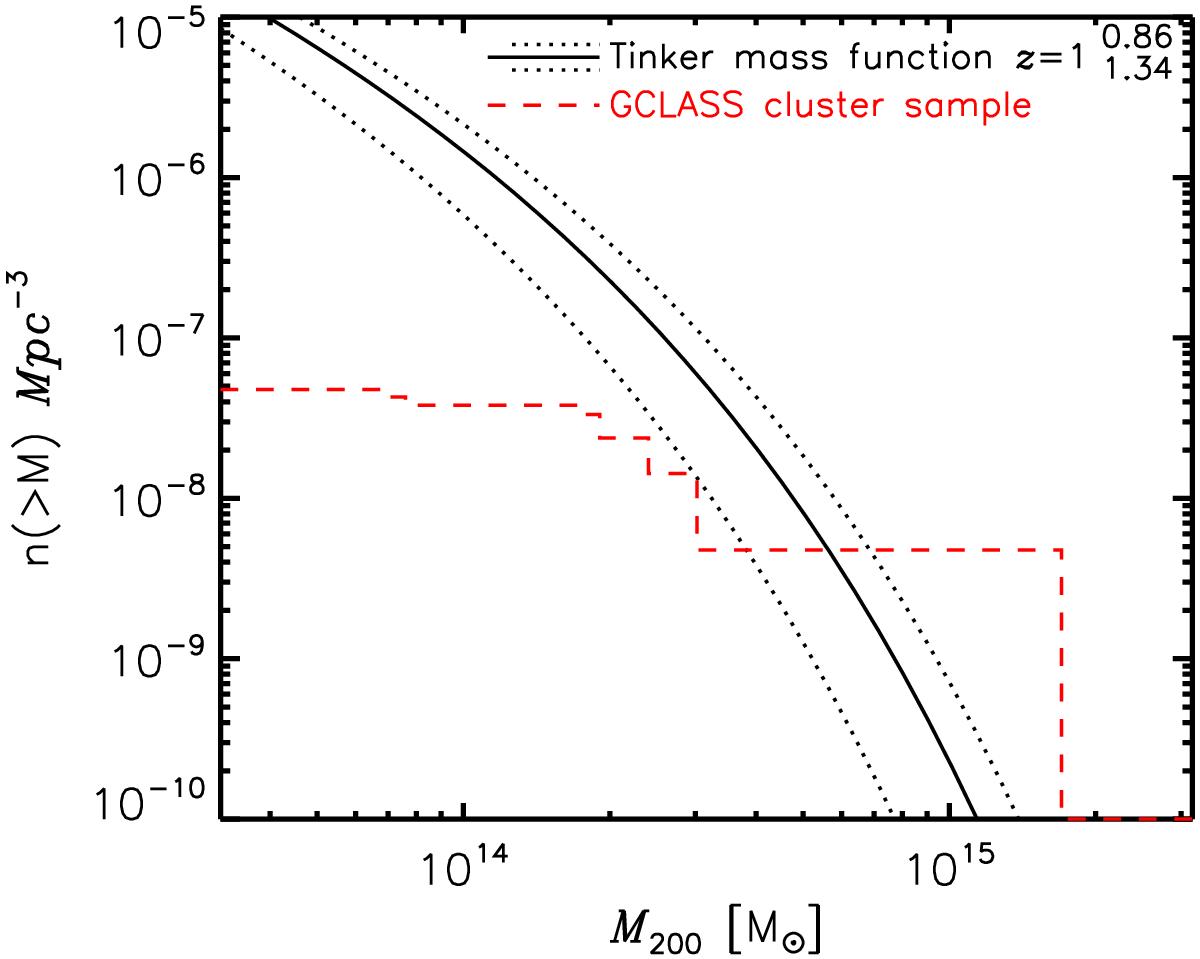
Black solid line: Tinker et al. (2008) cumulative mass function at z = 1 for WMAP7 cosmology. Black dotted lines: Tinker et al. (2008) cumulative mass functions at z = 0.86 and z = 1.34, which are the redshift limits within which the GCLASS clusters are selected. Red dashed line: cumulative mass function of the ten GCLASS clusters, normalised by the total volume of SpARCS.
Current usage metrics show cumulative count of Article Views (full-text article views including HTML views, PDF and ePub downloads, according to the available data) and Abstracts Views on Vision4Press platform.
Data correspond to usage on the plateform after 2015. The current usage metrics is available 48-96 hours after online publication and is updated daily on week days.
Initial download of the metrics may take a while.