Fig. 7
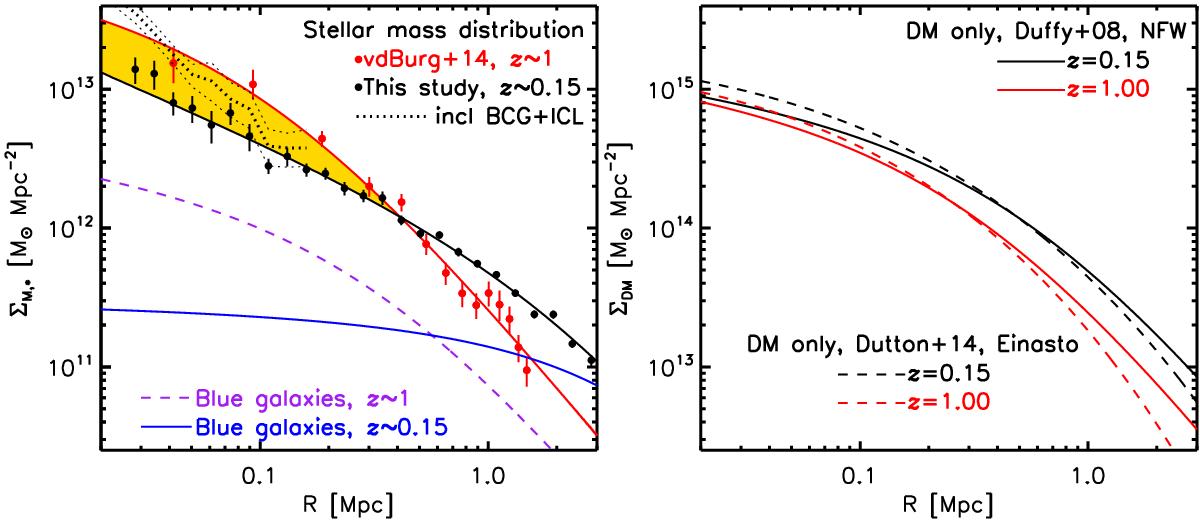
Left panel: red points: average stellar mass density profile of GCLASS, in physical units. Black points: stellar mass density profile at low-z, at the same physical scale. The orange region marks the part of the z ~ 1 profile that is in excess of the z ~ 0.15 profile, and comprises a stellar mass of about 7 × 10¹¹M⊙. Black dotted: stellar mass at z ~ 0.15, including BCG+ICL. Dashed purple and solid blue: stellar mass in blue galaxies at z ~ 1 and z ~ 0.15, respectively. Right panel: dark matter profiles from N-body simulations, using the average profile parameters from Duffy et al. (2008) and Dutton & Macciò (2014), but with the profiles plotted on the same physical scale. Shown are profiles at redshifts of z = 1.00 (red) and z = 0.15 (black), with masses of M200 = 3 × 10¹⁴M⊙ and M200 = 9 × 10¹⁴M⊙, respectively.
Current usage metrics show cumulative count of Article Views (full-text article views including HTML views, PDF and ePub downloads, according to the available data) and Abstracts Views on Vision4Press platform.
Data correspond to usage on the plateform after 2015. The current usage metrics is available 48-96 hours after online publication and is updated daily on week days.
Initial download of the metrics may take a while.