Fig. 6
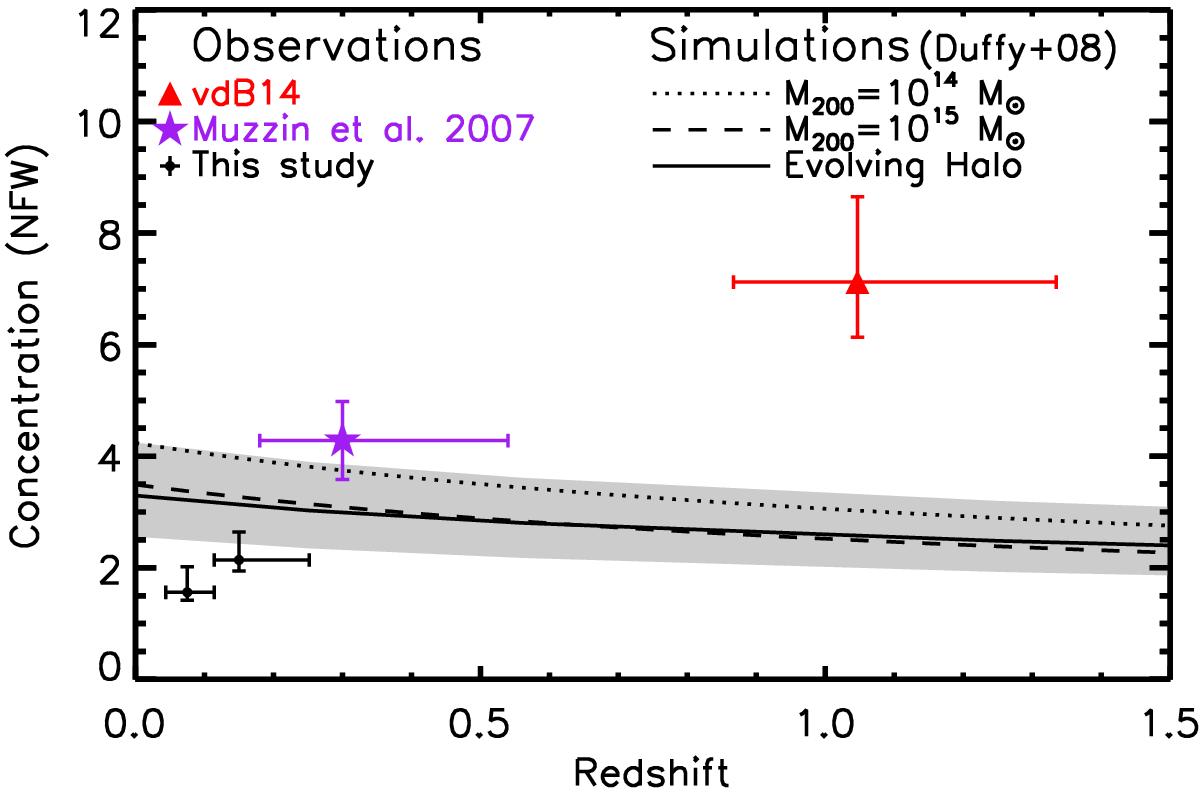
Black points: stellar mass density concentration for the clusters used in this study, split in two redshift bins. Purple: K-band luminosity density concentration in CNOC1 from Muzzin et al. (2007). Red: stellar mass density concentration in GCLASS from vdB14. The horizontal bars indicate the redshift range for each sample. Black lines: the NFW concentration in the sample of relaxed haloes from Duffy et al. (2008) as a function of redshift. Dotted and dashed: haloes of a given mass as a function of redshift. Solid: NFW concentration of a halo that is evolving in mass, with scatter given by the shaded region.
Current usage metrics show cumulative count of Article Views (full-text article views including HTML views, PDF and ePub downloads, according to the available data) and Abstracts Views on Vision4Press platform.
Data correspond to usage on the plateform after 2015. The current usage metrics is available 48-96 hours after online publication and is updated daily on week days.
Initial download of the metrics may take a while.