Fig. 5
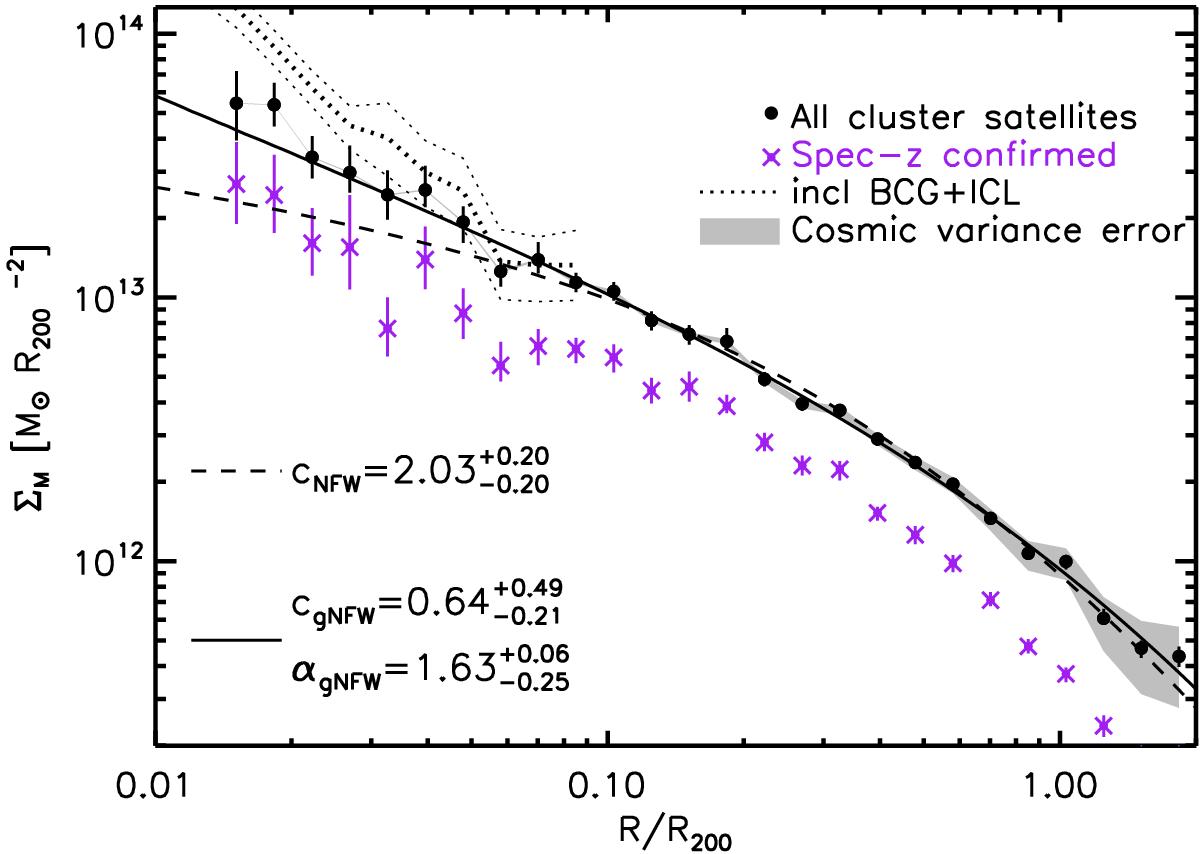
Stellar mass density distribution of the ensemble cluster at z ~ 0.15. Black points: cluster stellar mass distribution, with best-fitting projected NFW (dashed) and gNFW (solid) functions. Purple points: stellar mass distribution in spectroscopically confirmed cluster members. Dotted line: total stellar mass density profile on the images (background subtracted, with the 68% confidence region around these values shown by the thinner dotted lines), including the BCG and part of the ICL component.
Current usage metrics show cumulative count of Article Views (full-text article views including HTML views, PDF and ePub downloads, according to the available data) and Abstracts Views on Vision4Press platform.
Data correspond to usage on the plateform after 2015. The current usage metrics is available 48-96 hours after online publication and is updated daily on week days.
Initial download of the metrics may take a while.