Fig. 4
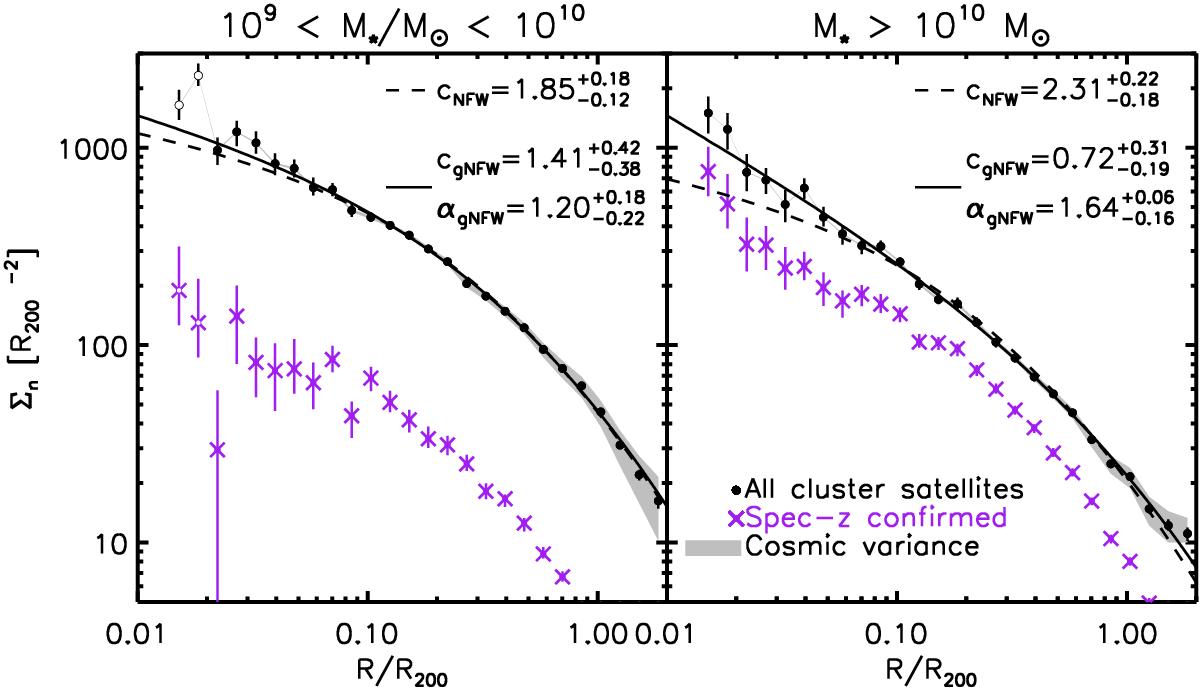
Galaxy number density distributions for masses 109<M⋆/M⊙< 1010 (left panel), and M⋆> 1010M⊙ (right panel) for the ensemble cluster at z ~ 0.15. Black points with the best-fitting projected NFW (dashed) and gNFW (solid) functions are our best estimates for the cluster number counts. The inner two points in the left panel are masked due to obscuration from the BCG, which is more severe for low-mass galaxies, and are excluded from the fitting. Purple points indicate the number of spectroscopically confirmed cluster members.
Current usage metrics show cumulative count of Article Views (full-text article views including HTML views, PDF and ePub downloads, according to the available data) and Abstracts Views on Vision4Press platform.
Data correspond to usage on the plateform after 2015. The current usage metrics is available 48-96 hours after online publication and is updated daily on week days.
Initial download of the metrics may take a while.