Fig. 1
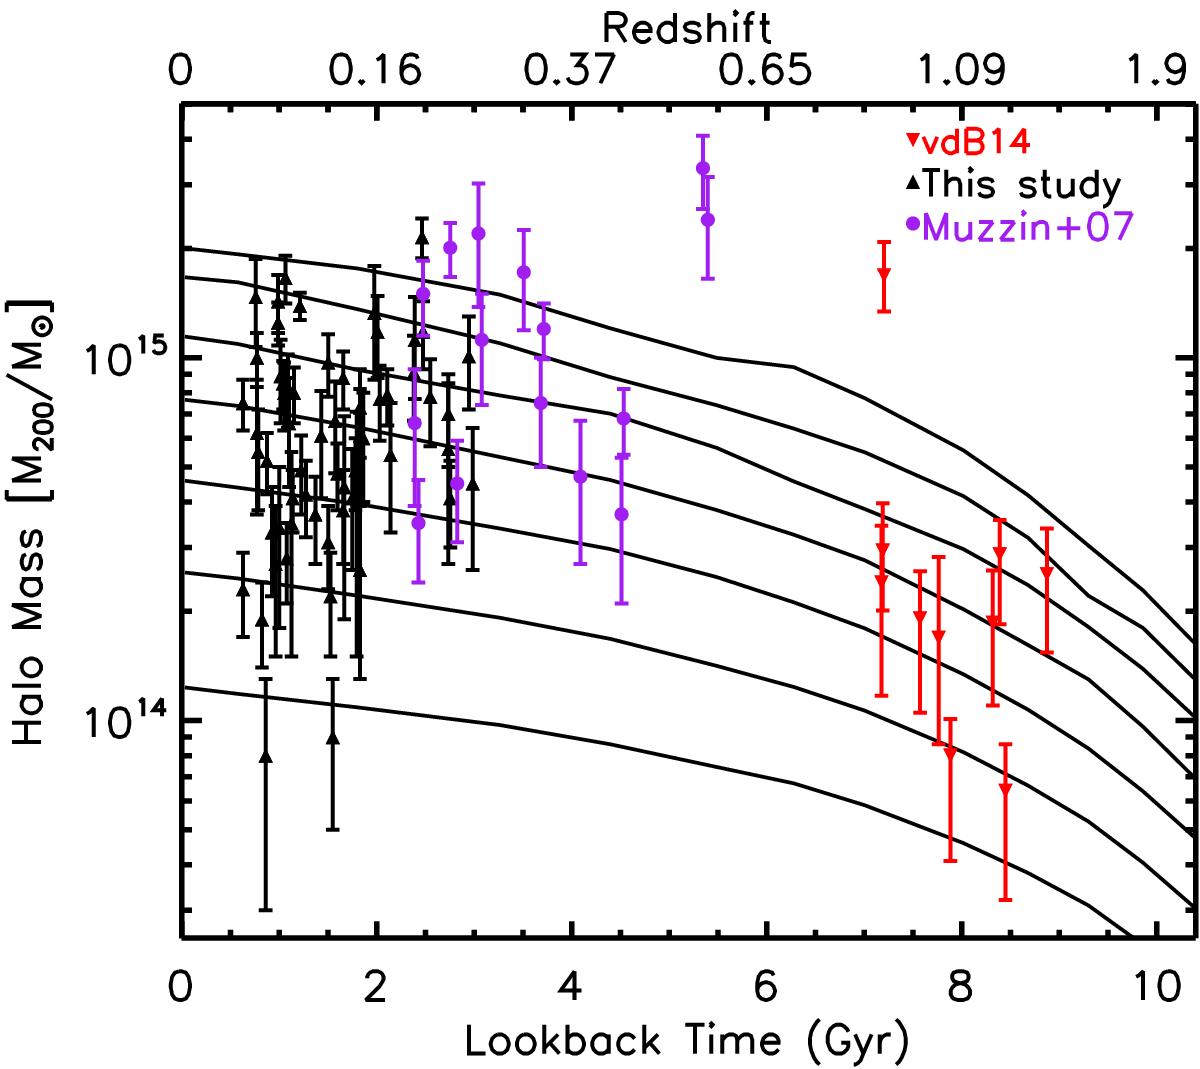
Lines: expected growth curves as a function of cosmic time (or redshift) for massive haloes based on the Millennium simulation (Springel et al. 2005), in which we followed these haloes at fixed cumulative comoving number density. Red: the GCLASS cluster sample studied in vdB14. Black triangles: low redshift cluster sample studied here. Purple: the CNOC1 cluster sample studied by Muzzin et al. (2007). The cluster samples are linked by the evolutionary growth curves.
Current usage metrics show cumulative count of Article Views (full-text article views including HTML views, PDF and ePub downloads, according to the available data) and Abstracts Views on Vision4Press platform.
Data correspond to usage on the plateform after 2015. The current usage metrics is available 48-96 hours after online publication and is updated daily on week days.
Initial download of the metrics may take a while.