Fig. A.1
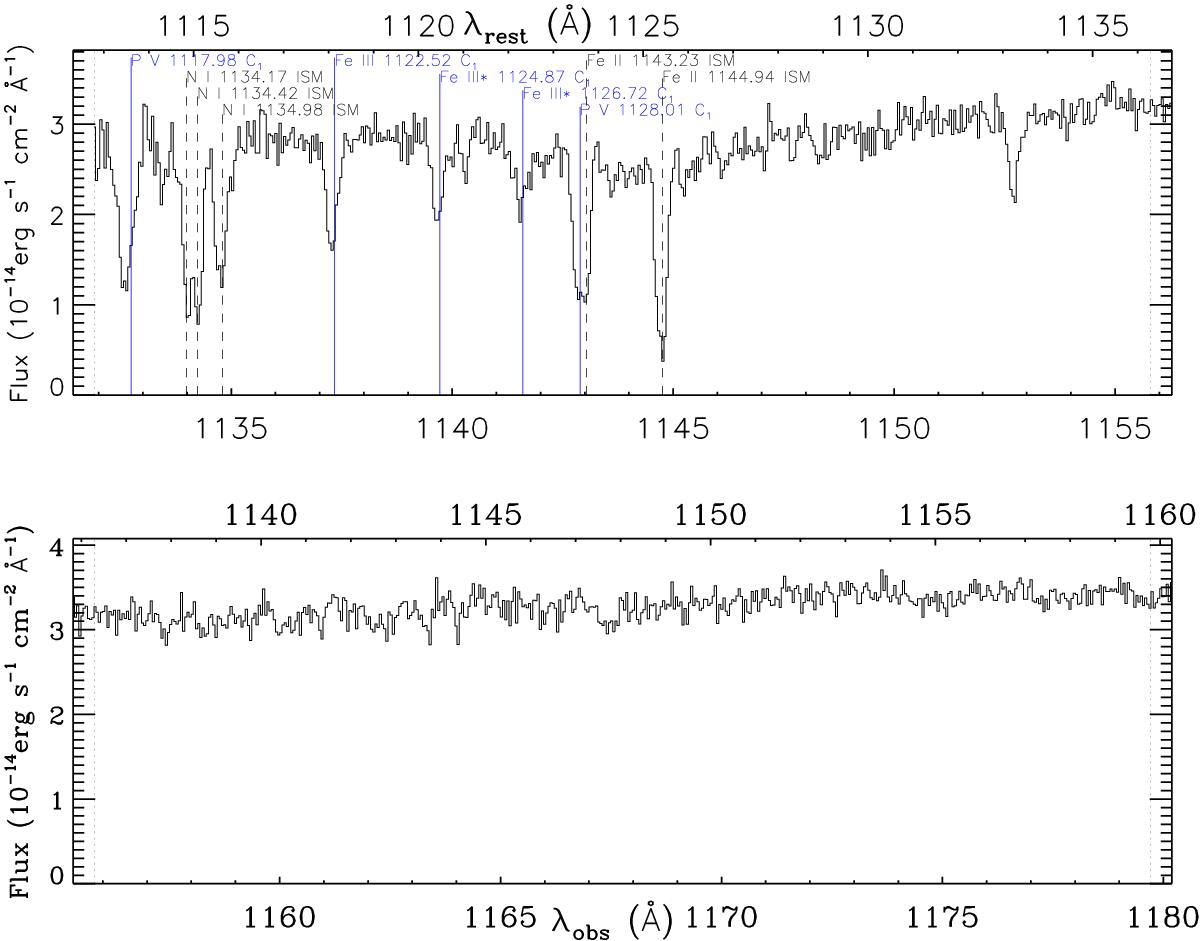
2013 spectrum of NGC 5548. The vertical axis is the flux in units of 10-14 erg s-1 cm-2 Å-1, and the quasar-rest-frame and observer-frame wavelengths are given in Angstroms on the top and bottom of each sub-plot, respectively. Each of the six kinematic components of the outflow shows absorption troughs from several ions. We place a vertical mark at the expected center of each absorption trough (following the velocity template of Si iv and N v) and state the ion, rest-wavelength and component number (C1–C6). We also assign a color to each component number that ranges from blue (C1) to red (C6). Absorption lines from the ISM are likewise marked in black with dashed lines.
Current usage metrics show cumulative count of Article Views (full-text article views including HTML views, PDF and ePub downloads, according to the available data) and Abstracts Views on Vision4Press platform.
Data correspond to usage on the plateform after 2015. The current usage metrics is available 48-96 hours after online publication and is updated daily on week days.
Initial download of the metrics may take a while.