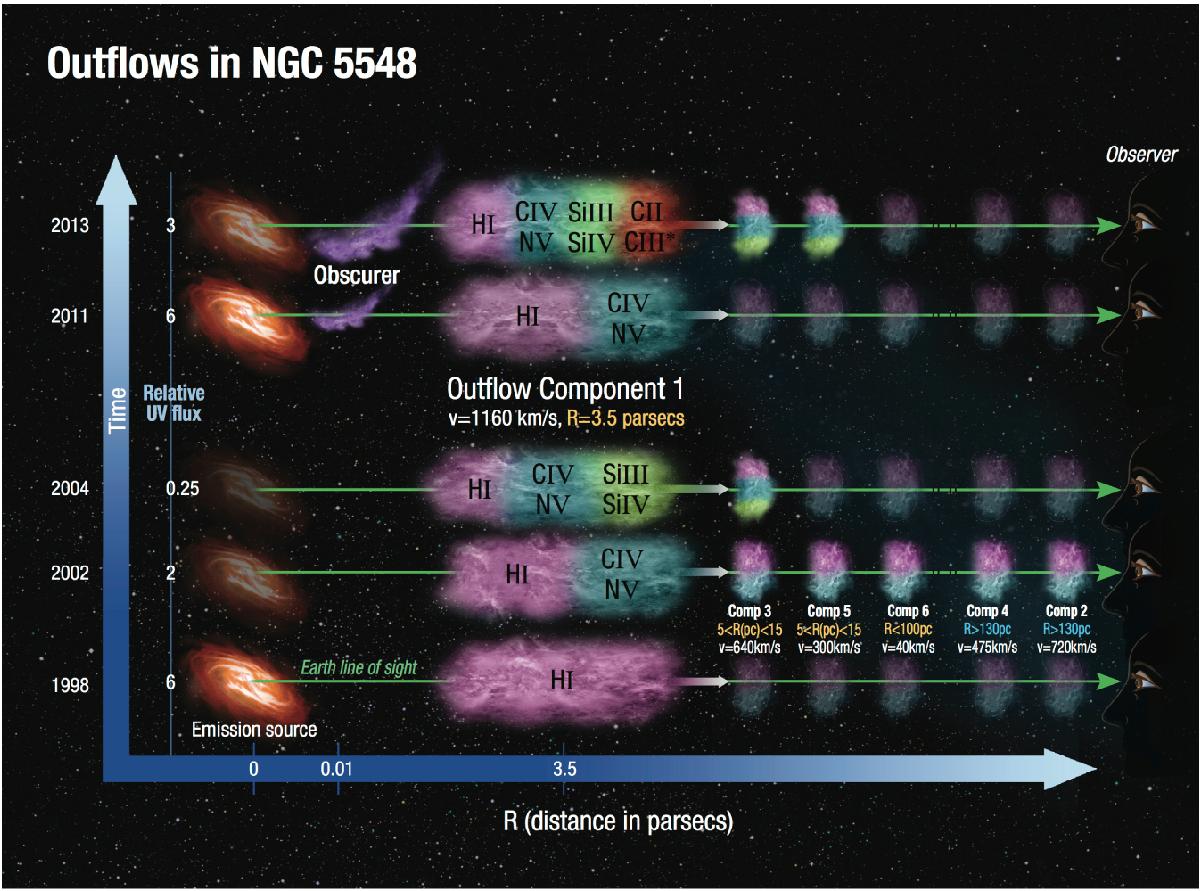
Fig. 6

An illustration of the physical, spatial and temporal conditions of the outflows seen in NGC 5548. Along the time axis we show the behavior of the emission source at the five UV epochs and give its UV flux values (measured at 1350 Å rest-frame and given in units of 10-14 erg s-1 cm-2 Å-1). The obscurer is situated at roughly 0.01 pc from the emission source and is only seen in 2011 and 2013 (it is much stronger in 2013). Outflow component 1 shows the most dramatic changes in its absorption troughs. Different observed ionic species are represented as colored zones within the absorbers. The trough changes are fully explained by our physical model shown in Fig. 5. Using component 1 C iii* troughs, which are only seen in the 2013 epoch, we determine its number density (see Fig. 4) to be log (ne) = 4.8 ± 0.1 cm-3, and therefore its distance, R = 3.5 pc. The distances for the other components are discussed in Sect. 4. Dimmer clouds represent epochs where components 2−6 did not show new absorption species compared with the 2002 epoch.
Current usage metrics show cumulative count of Article Views (full-text article views including HTML views, PDF and ePub downloads, according to the available data) and Abstracts Views on Vision4Press platform.
Data correspond to usage on the plateform after 2015. The current usage metrics is available 48-96 hours after online publication and is updated daily on week days.
Initial download of the metrics may take a while.


