Fig. 5
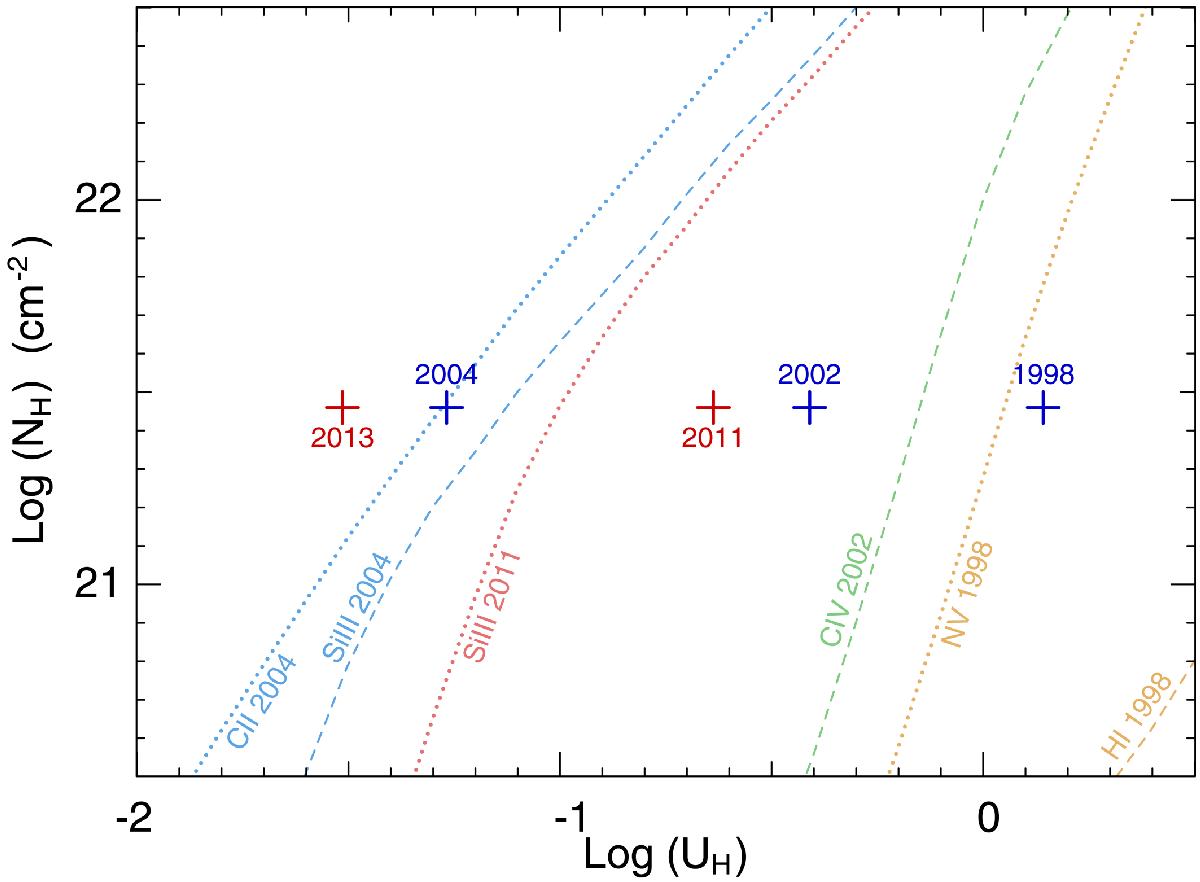
Photoionization phase plot showing the ionization solutions for component 1 for all five epochs. The 2013 epoch solution is identical to the one shown in Fig. 3. For the 1998, 2002, and 2004 epochs we used the high SED (see Fig. 2) with the same abundances, and their ionization solutions are shown in blue crosses. Dashed lines represent Nion lower-limit that allow the phase-space above the line, while the dotted lines are upper-limits that allow the phase-space below the line (only the most restrictive constraints are shown). NH is fixed for all epochs at the value determined from the 2013 solution. For 1998, 2002 and 2004 the difference in UH values is determined by the ratio of fluxes at 1350 Å and the actual value is anchored by the observed Nion constraints. As explained in Sect. 3.3, the UH position of the 2011 epoch is less tightly constrained. The solution for each epoch satisfies all the Nion constraints for that epoch.
Current usage metrics show cumulative count of Article Views (full-text article views including HTML views, PDF and ePub downloads, according to the available data) and Abstracts Views on Vision4Press platform.
Data correspond to usage on the plateform after 2015. The current usage metrics is available 48-96 hours after online publication and is updated daily on week days.
Initial download of the metrics may take a while.