Fig. 4
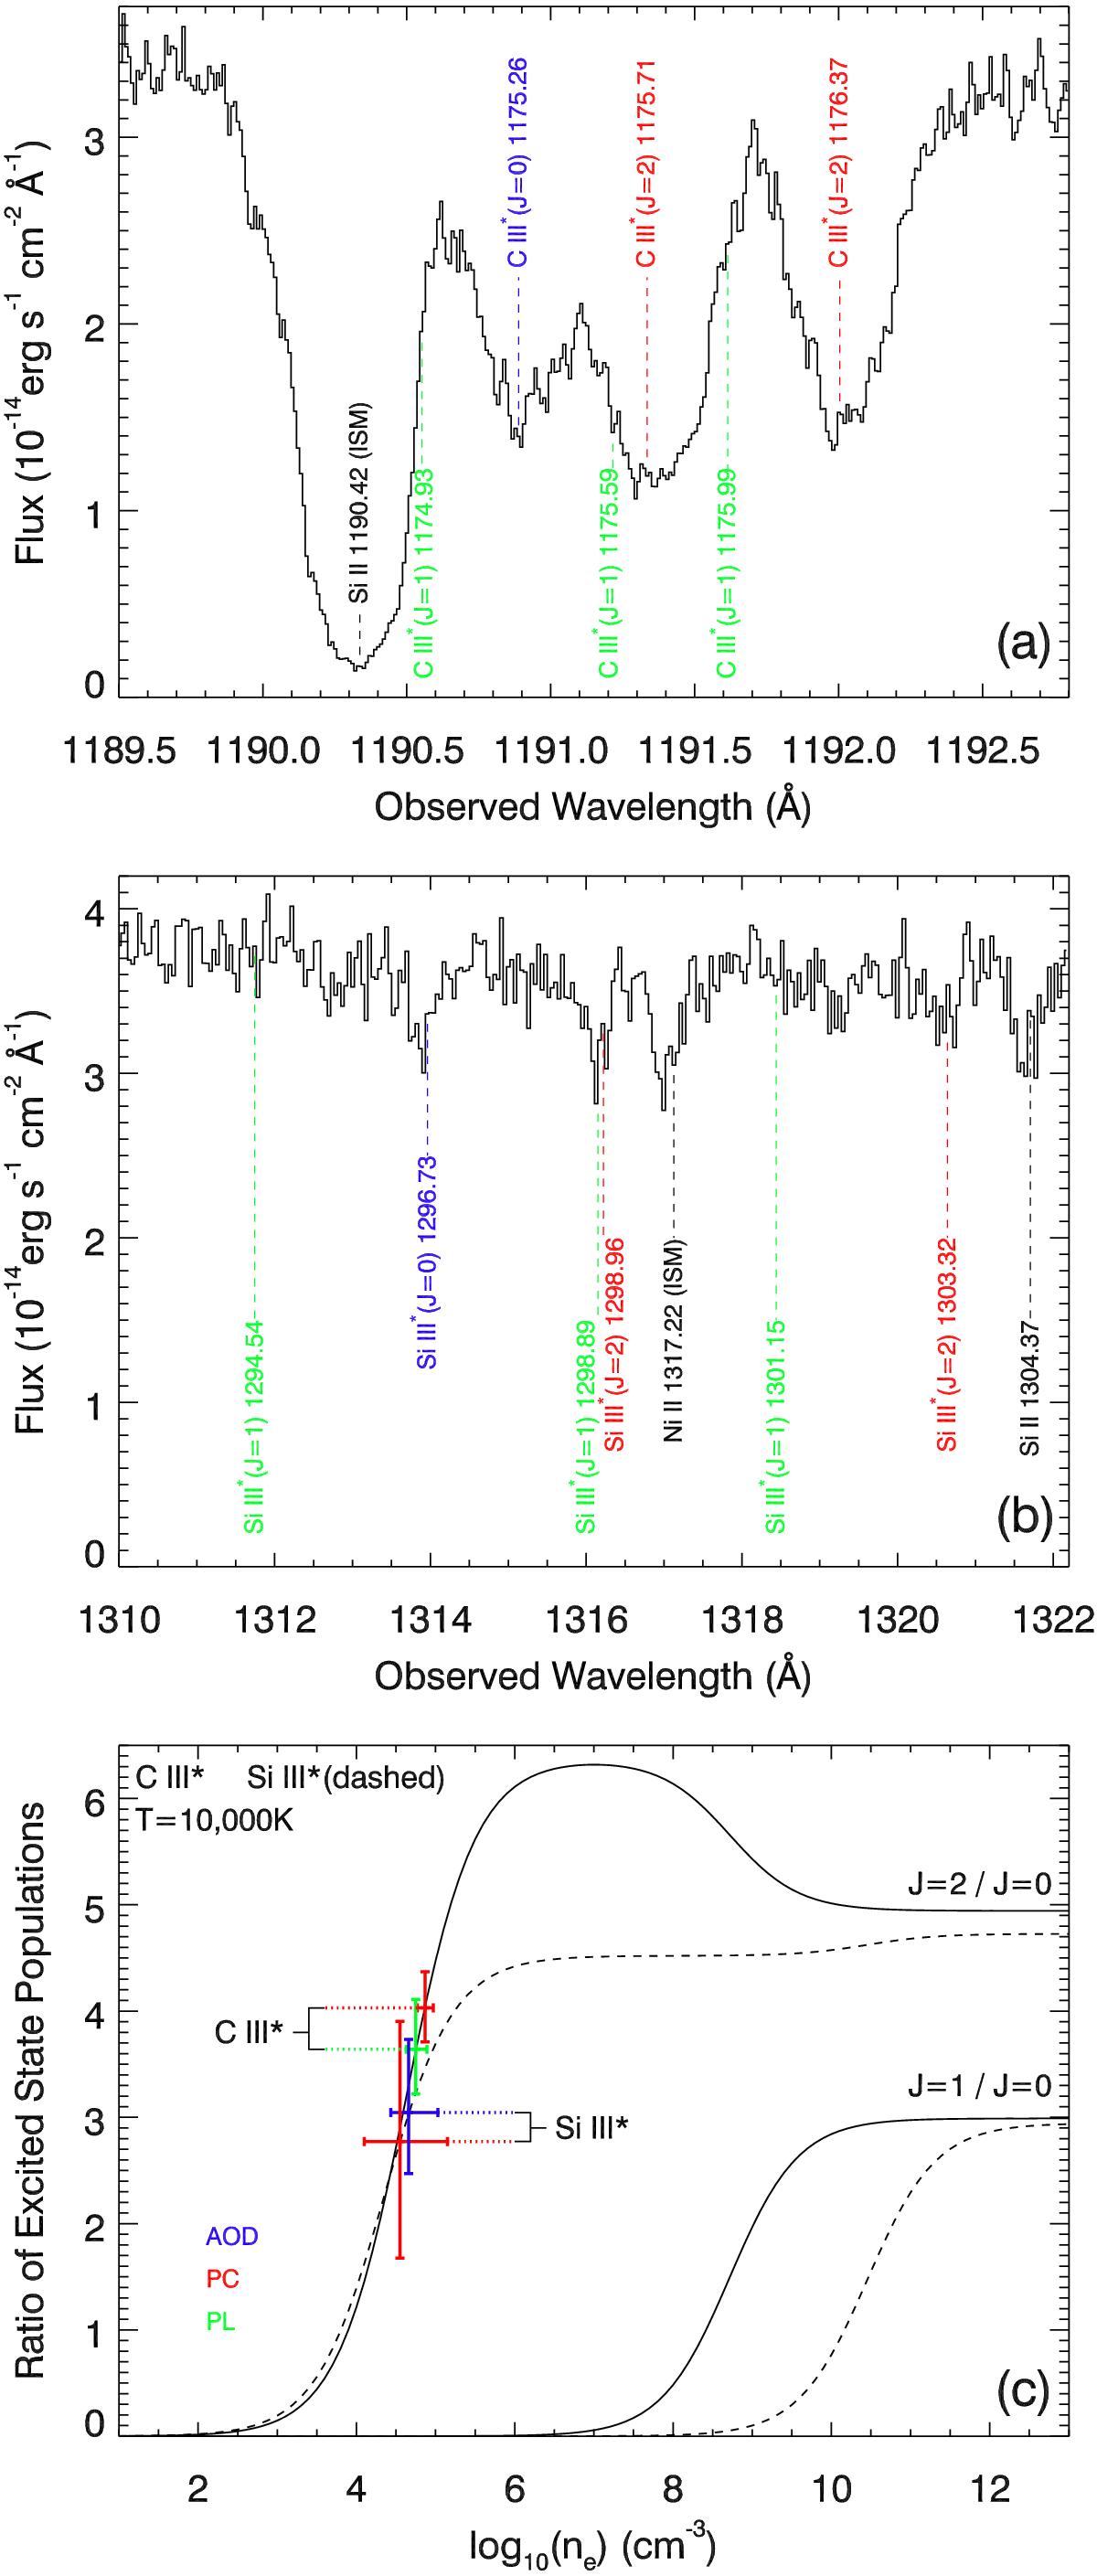
a) Absorption spectrum for the C iii* 1175 Å multiplet. The 2013 COS spectrum shows clear and relatively unblended individual troughs from the J = 2 and J = 0 levels, but no contribution from the J = 1 level that is populated at higher densities (see panel c)). b) Absorption spectrum for the Si iii* 1298 Å multiplet (similar in level structure to the C iii* 1175 Å multiplet). The 2013 COS spectrum shows shallow but highly significant individual troughs from the J = 2 and J = 0 levels, but again no contribution from the J = 1 level that is populated at higher densities. c) C iii* and Si iii* level population ratios, theory and measurements. The computed populations for the J = 2/J = 0 and J = 1/J = 0 are plotted as a function of electron number density for both ions (see text for elaboration). The crosses show the measured ratios for the J = 2/J = 0 ratio of both ions. From the C iii* ratios we infer log (ne) = 4.8 ± 0.1 cm-3, where the error includes both statistical and systematic effects. This value is fully consistent with the one inferred from the Si iii* ratio, where in the case of Si iii* the statistical error is larger since the troughs are much shallower.
Current usage metrics show cumulative count of Article Views (full-text article views including HTML views, PDF and ePub downloads, according to the available data) and Abstracts Views on Vision4Press platform.
Data correspond to usage on the plateform after 2015. The current usage metrics is available 48-96 hours after online publication and is updated daily on week days.
Initial download of the metrics may take a while.