Fig. 3
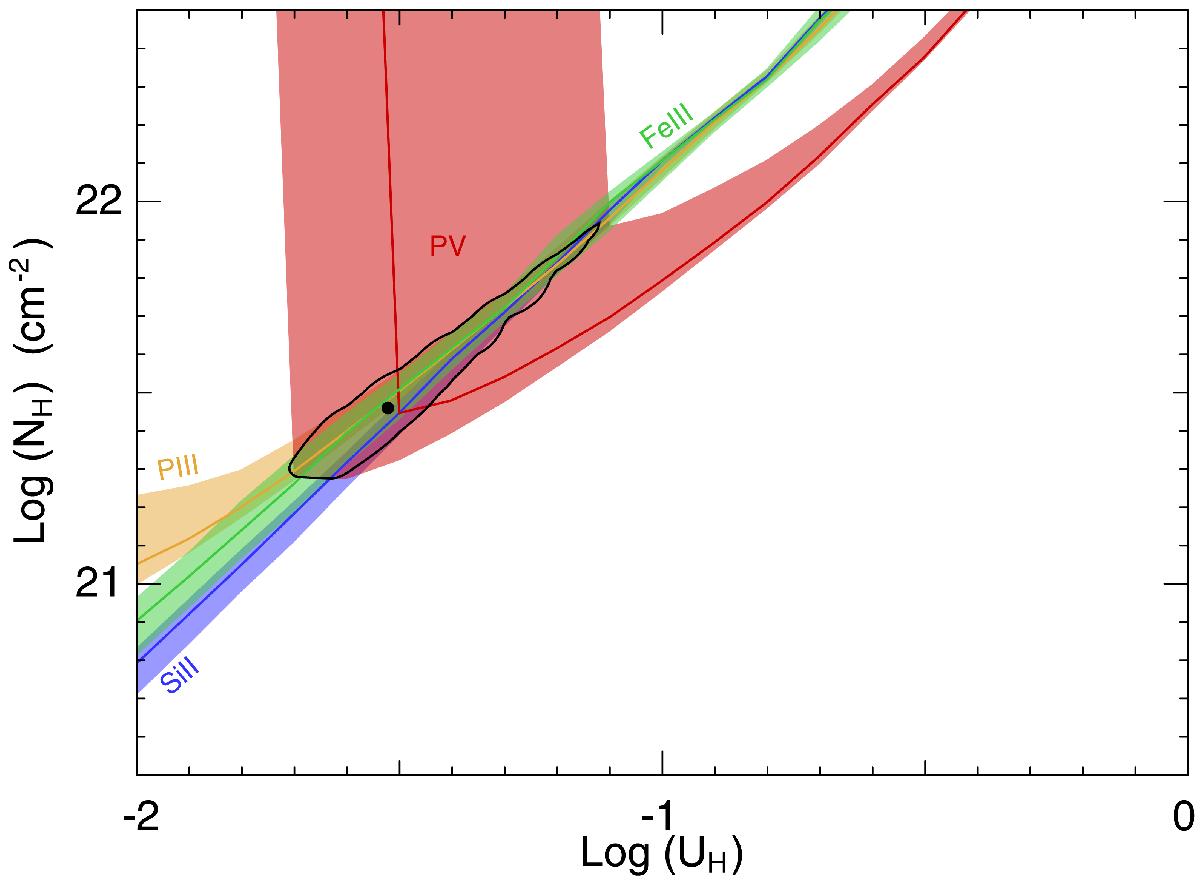
Photoionization phase plot showing the ionization solution for component 1 epoch 2013. We use the obscured SED and assumed proto-solar metalicity (Lodders et al. 2009). Solid lines and associated colored bands represent the locus of UH,NH models, which predict the measured Nion, and their 1σ uncertainties. The black dot is the best solution and is surrounded by a 1σχ2 contour.
Current usage metrics show cumulative count of Article Views (full-text article views including HTML views, PDF and ePub downloads, according to the available data) and Abstracts Views on Vision4Press platform.
Data correspond to usage on the plateform after 2015. The current usage metrics is available 48-96 hours after online publication and is updated daily on week days.
Initial download of the metrics may take a while.