Fig. A.2
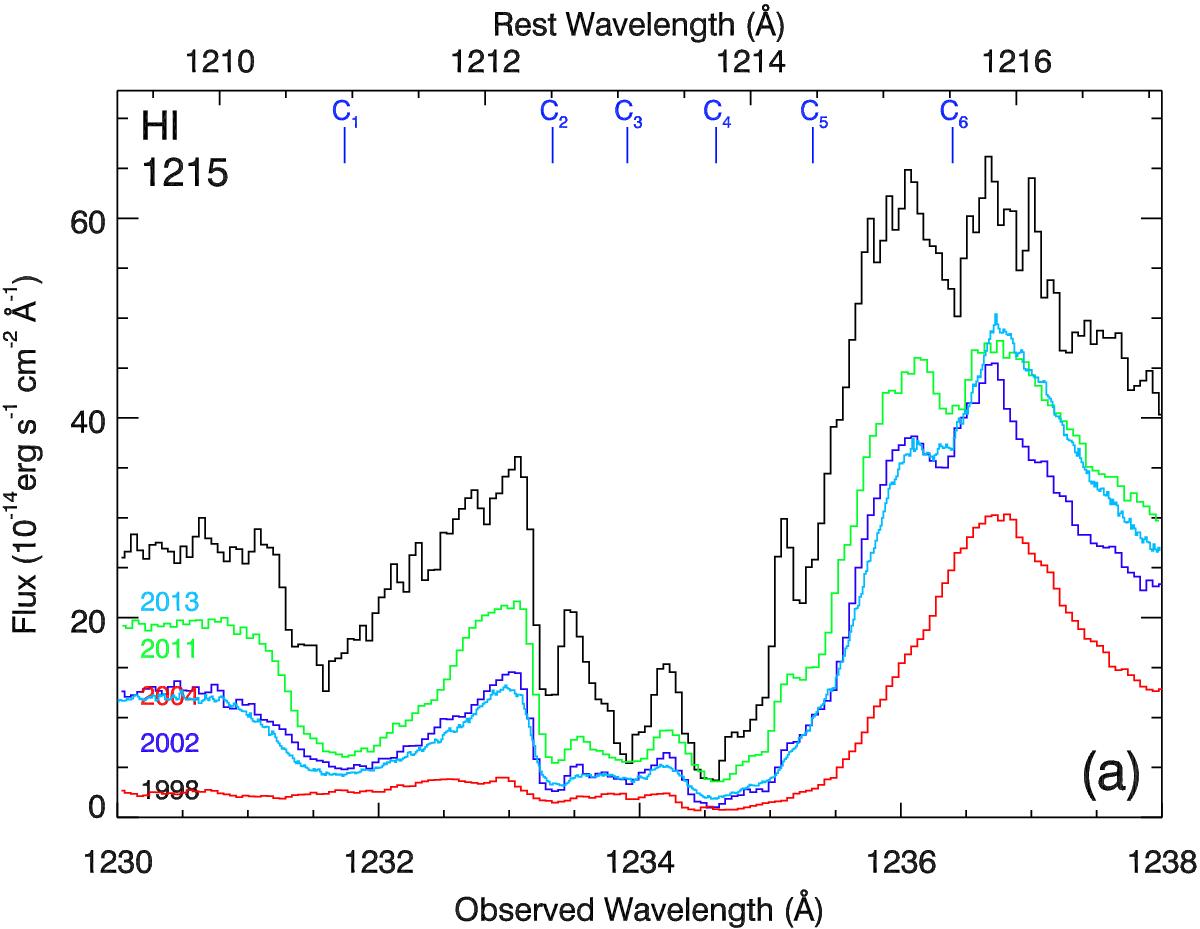
Spectrum of NGC 5548 during the five epochs of observation. The 2013 spectrum is obtained by co-adding visits 1 through 5. Spectral regions where absorption troughs from five ions are shown in sub-plots a) through e) and the six kinematic components associated with such absorption are labelled C1 through C6.
Current usage metrics show cumulative count of Article Views (full-text article views including HTML views, PDF and ePub downloads, according to the available data) and Abstracts Views on Vision4Press platform.
Data correspond to usage on the plateform after 2015. The current usage metrics is available 48-96 hours after online publication and is updated daily on week days.
Initial download of the metrics may take a while.