Fig. 1
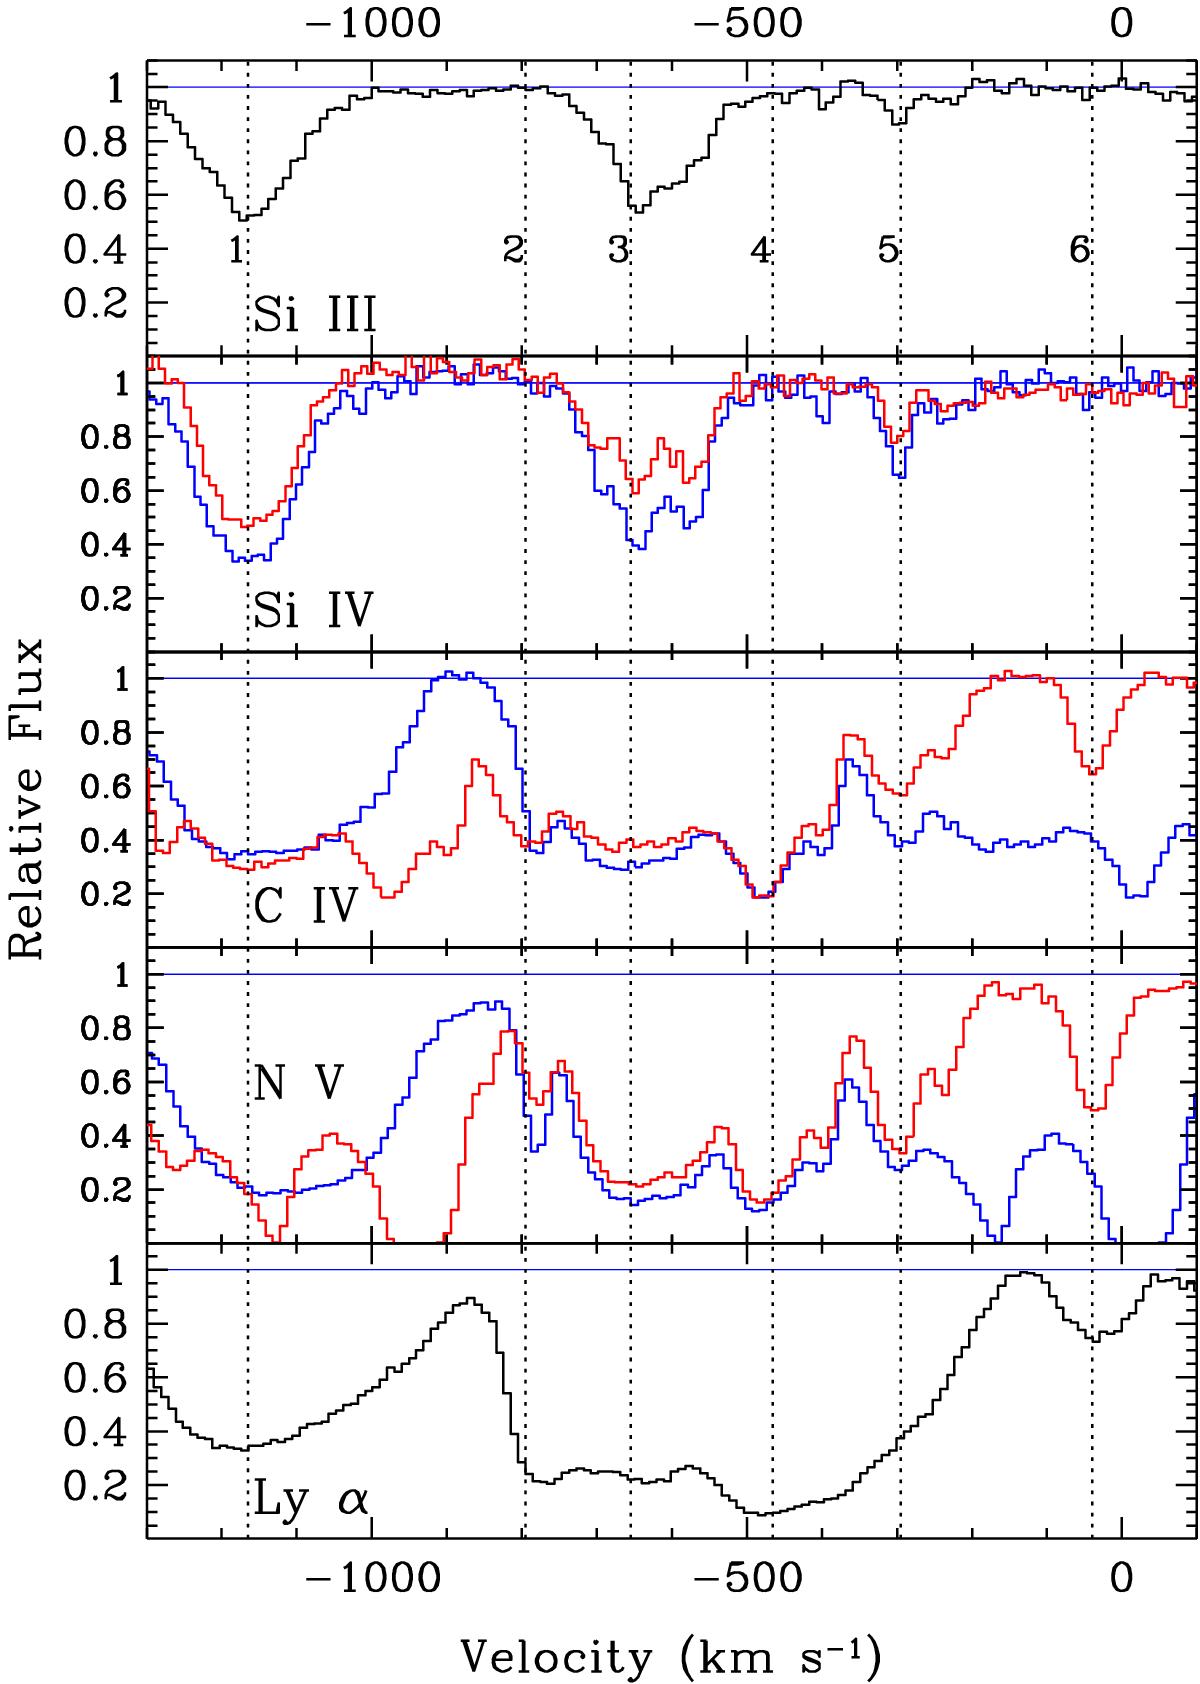
Intrinsic absorption features in the 2013 COS spectrum of NGC 5548. Normalized relative fluxes are plotted as a function of velocity relative to the systemic redshift of z = 0.017175, top to bottom: Si iiiλ1206, Si ivλλ1394,1403, C ivλλ1548,1550, N vλλ1238,1242, and Ly α, as a function of rest-frame velocity. For the doublets the red and blue components are shown in red and blue, respectively. Dotted vertical lines indicate the velocities of the absorption components numbered as in Crenshaw et al. (2003).
Current usage metrics show cumulative count of Article Views (full-text article views including HTML views, PDF and ePub downloads, according to the available data) and Abstracts Views on Vision4Press platform.
Data correspond to usage on the plateform after 2015. The current usage metrics is available 48-96 hours after online publication and is updated daily on week days.
Initial download of the metrics may take a while.