Fig. 1
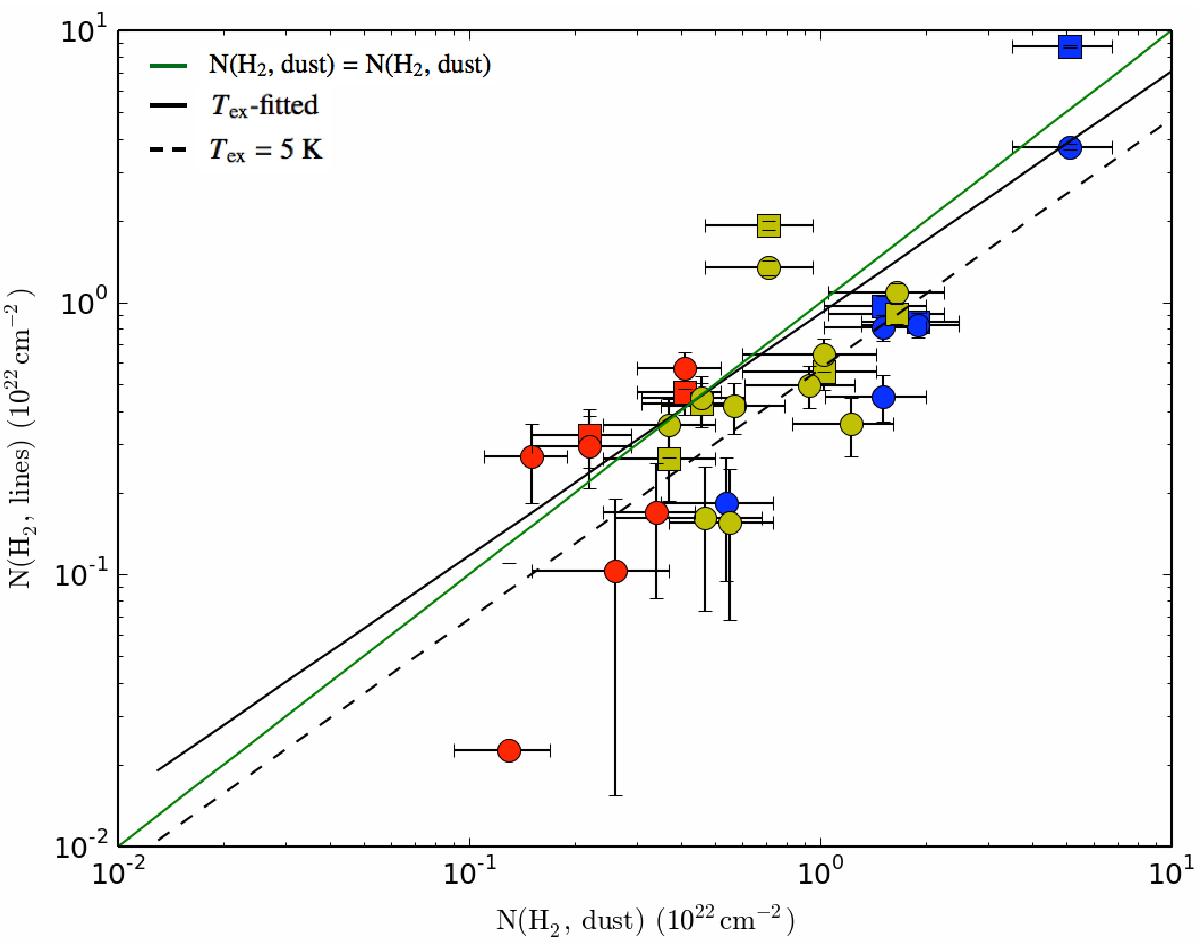
Comparison of the column densities derived from molecular line and dust continuum observations. The squares are the column densities, where the excitation temperature could be calculated, and the circles are the column densities calculated with an assumed excitation temperature of 5 K. The colors indicate the dust color temperature. Blue is below 11 K, yellow is 11−13 K, and red is warmer than 13 K. The solid line is the linear least-squares fit to the column densities derived from the calculated excitation temperature, and the dashed line fits the Tex = 5 K values. The green line indicates a line where NH2dust = NH2line.
Current usage metrics show cumulative count of Article Views (full-text article views including HTML views, PDF and ePub downloads, according to the available data) and Abstracts Views on Vision4Press platform.
Data correspond to usage on the plateform after 2015. The current usage metrics is available 48-96 hours after online publication and is updated daily on week days.
Initial download of the metrics may take a while.