Fig. 6
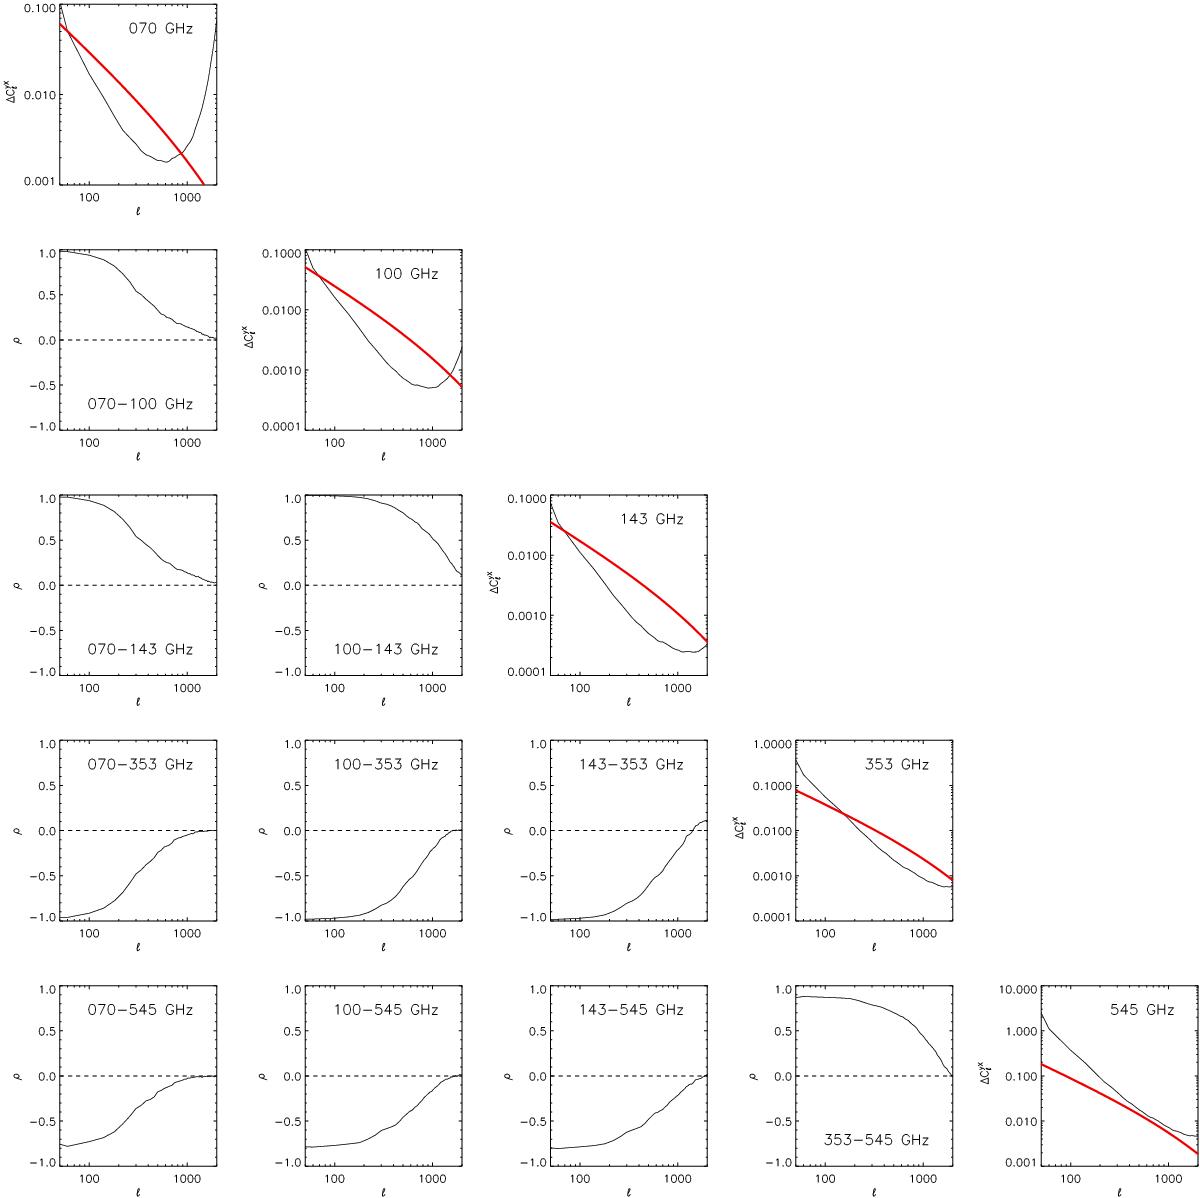
Diagonal figures show in black the uncertainty level for ![]() in units of KCMB cts s-1 armin-2 sr for the cleaned power spectra between the RASS map in the 0.5−2.0 keV energy range and the Planck maps at 70, 100, 143, 353, and 545 GHz, using a binning of Δℓ = 40, In red we show the tSZ-Xray cross-power spectrum for the model. The off diagonal figures show the correlation factor ρ between
in units of KCMB cts s-1 armin-2 sr for the cleaned power spectra between the RASS map in the 0.5−2.0 keV energy range and the Planck maps at 70, 100, 143, 353, and 545 GHz, using a binning of Δℓ = 40, In red we show the tSZ-Xray cross-power spectrum for the model. The off diagonal figures show the correlation factor ρ between ![]() at frequencies ν and ν′. See Sect. 5.1 for details on computing uncertainties and their covariance.
at frequencies ν and ν′. See Sect. 5.1 for details on computing uncertainties and their covariance.
Current usage metrics show cumulative count of Article Views (full-text article views including HTML views, PDF and ePub downloads, according to the available data) and Abstracts Views on Vision4Press platform.
Data correspond to usage on the plateform after 2015. The current usage metrics is available 48-96 hours after online publication and is updated daily on week days.
Initial download of the metrics may take a while.