Fig. 5
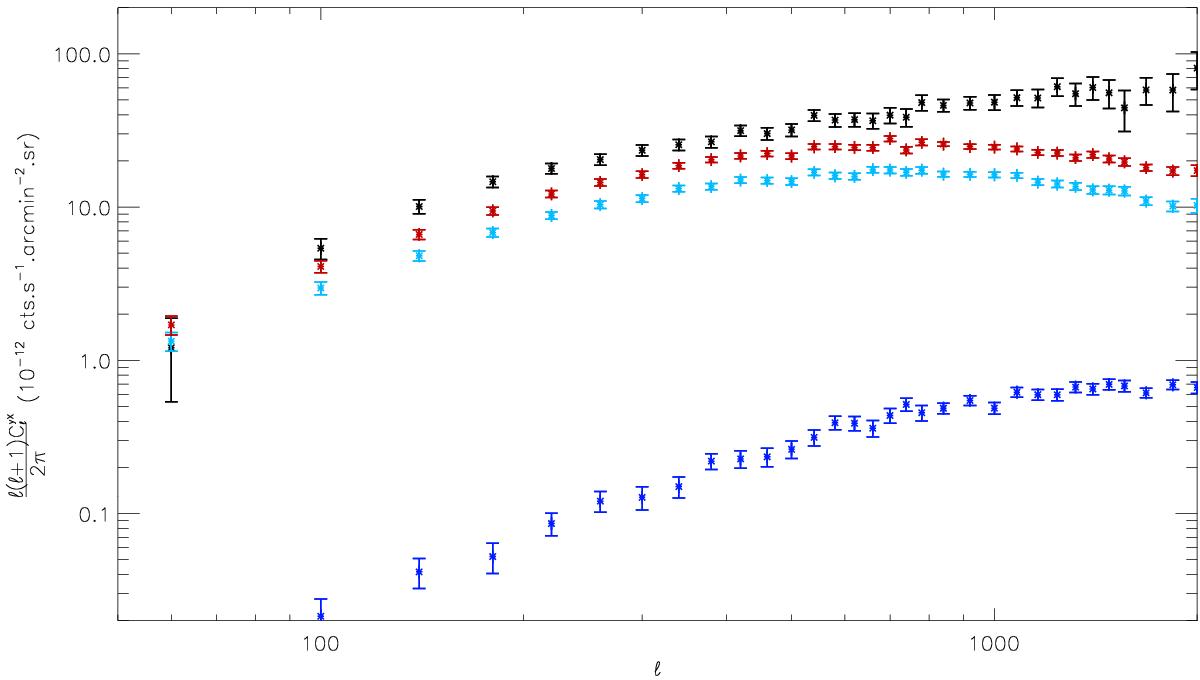
In black we present the cross-correlation power spectrum between the RASS in the 0.5−2.0 keV energy range map and the MILCA y-map computed from Planck data, in red the contribution from all clusters in the MCXC catalogue (Piffaretti et al. 2011), in light blue the contribution from all known clusters in the PSZ catalogue (Planck Collaboration XXIX 2014), and in dark blue the contribution from the Planck cosmo sample used in Planck Collaboration XX (2014).
Current usage metrics show cumulative count of Article Views (full-text article views including HTML views, PDF and ePub downloads, according to the available data) and Abstracts Views on Vision4Press platform.
Data correspond to usage on the plateform after 2015. The current usage metrics is available 48-96 hours after online publication and is updated daily on week days.
Initial download of the metrics may take a while.