Fig. 3
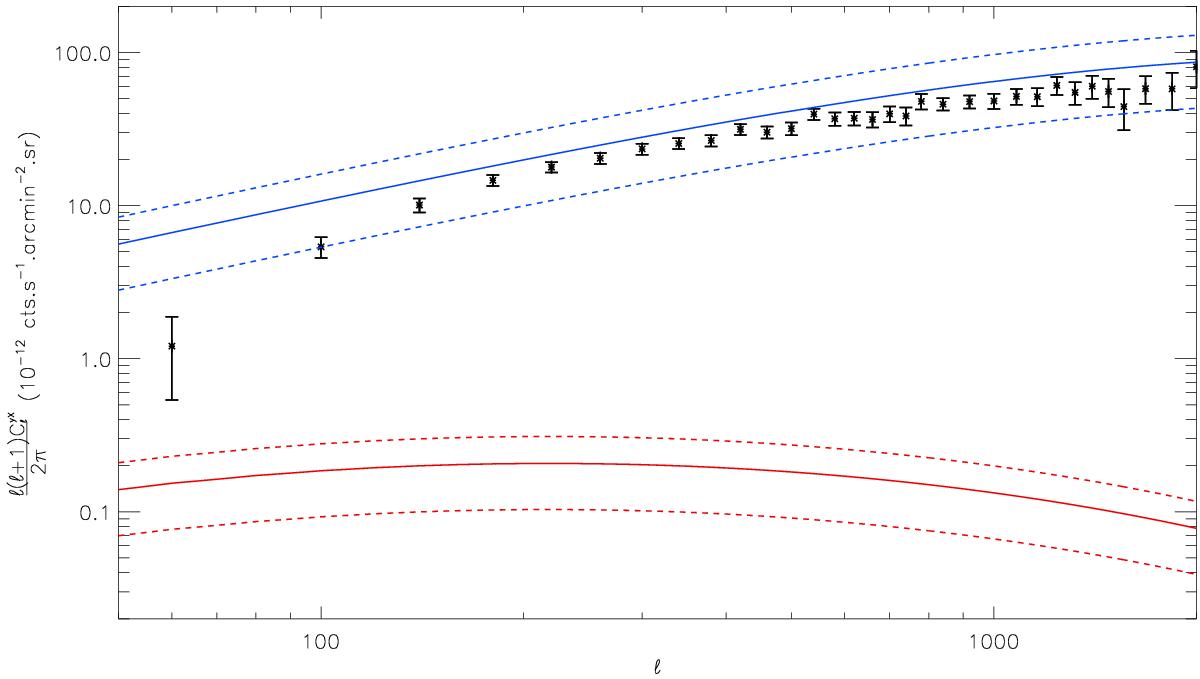
In black: cross-correlation power spectrum between the RASS in the 0.5−2.0 keV energy band map and the MILCA y-map computed from Planck data. As a dark blue solid line we show the theoretical one-halo tSZ-Xray cross-correlation power spectrum for Planck best-fitting cosmological parameters, in red the contribution of the two-halo term, and as dashed lines we show the 1σ uncertainties on the theoretical prediction as estimated in Hurier et al. (2014). Uncertainties have been computed as presented in Eq. (15).
Current usage metrics show cumulative count of Article Views (full-text article views including HTML views, PDF and ePub downloads, according to the available data) and Abstracts Views on Vision4Press platform.
Data correspond to usage on the plateform after 2015. The current usage metrics is available 48-96 hours after online publication and is updated daily on week days.
Initial download of the metrics may take a while.