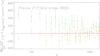
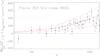
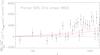
Fig. 2
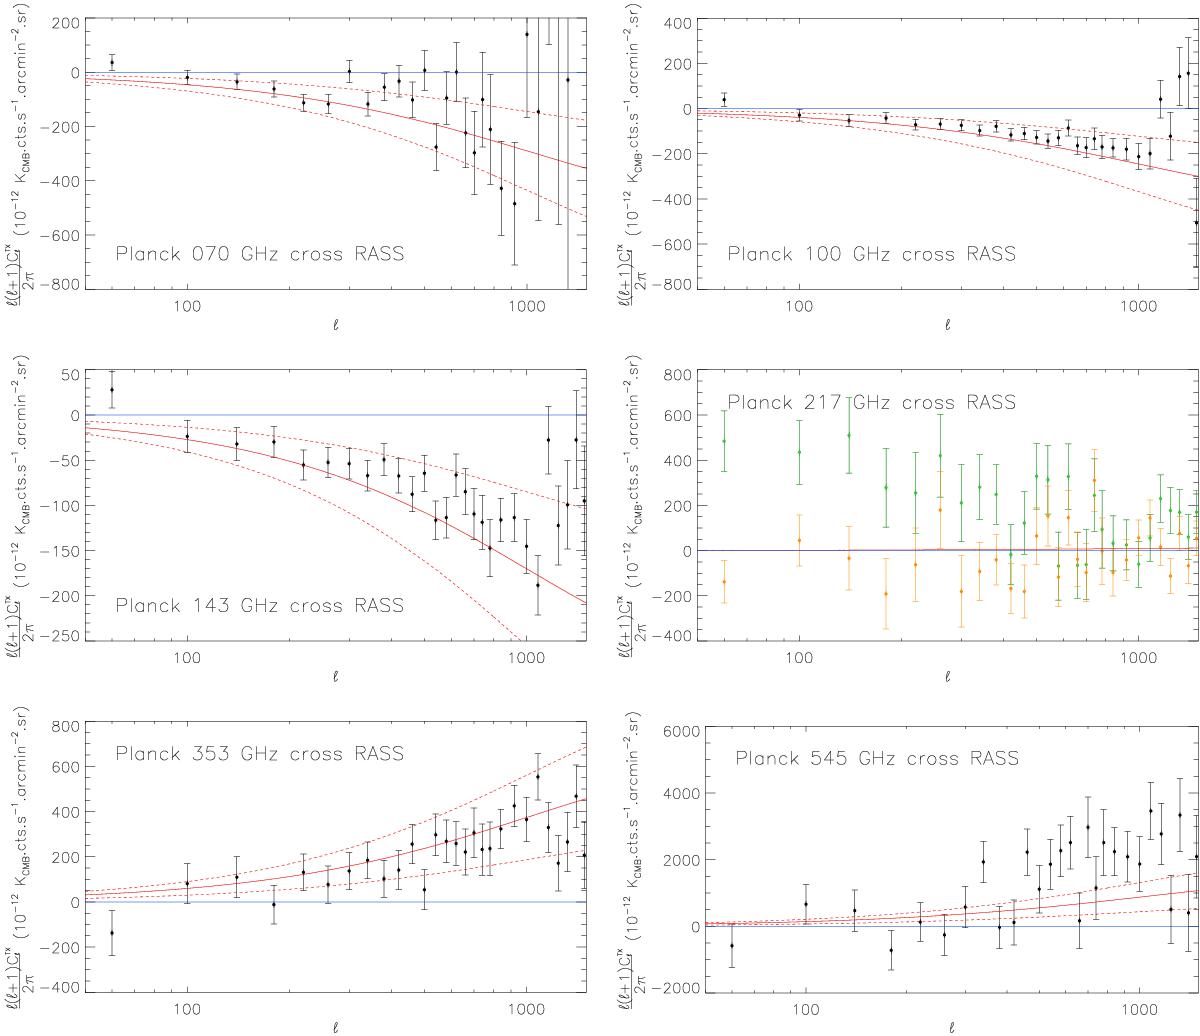
Cleaned cross-correlation power spectra between the RASS in the 0.5−2.0 keV energy band and the Planck frequency maps. From left to right and top to bottom we display spectra for 70, 100, 143, 217, 353 and 545 GHz. Data samples and error bars at 1σ are presented in black, the theoretical prediction using the Planck best-fitting cosmological parameters is plotted as a red solid line, the 1σ uncertainties on the theoretical prediction as estimated in Hurier et al. (2014) are depicted as red dashed lines, the cross-correlation at 217 GHz before CMB and dust subtraction is displayed in green, and the cross-correlation at 217 GHz only corrected for dust in orange. Uncertainties have been computed as presented in Eq. (13).
Current usage metrics show cumulative count of Article Views (full-text article views including HTML views, PDF and ePub downloads, according to the available data) and Abstracts Views on Vision4Press platform.
Data correspond to usage on the plateform after 2015. The current usage metrics is available 48-96 hours after online publication and is updated daily on week days.
Initial download of the metrics may take a while.