Fig. 6
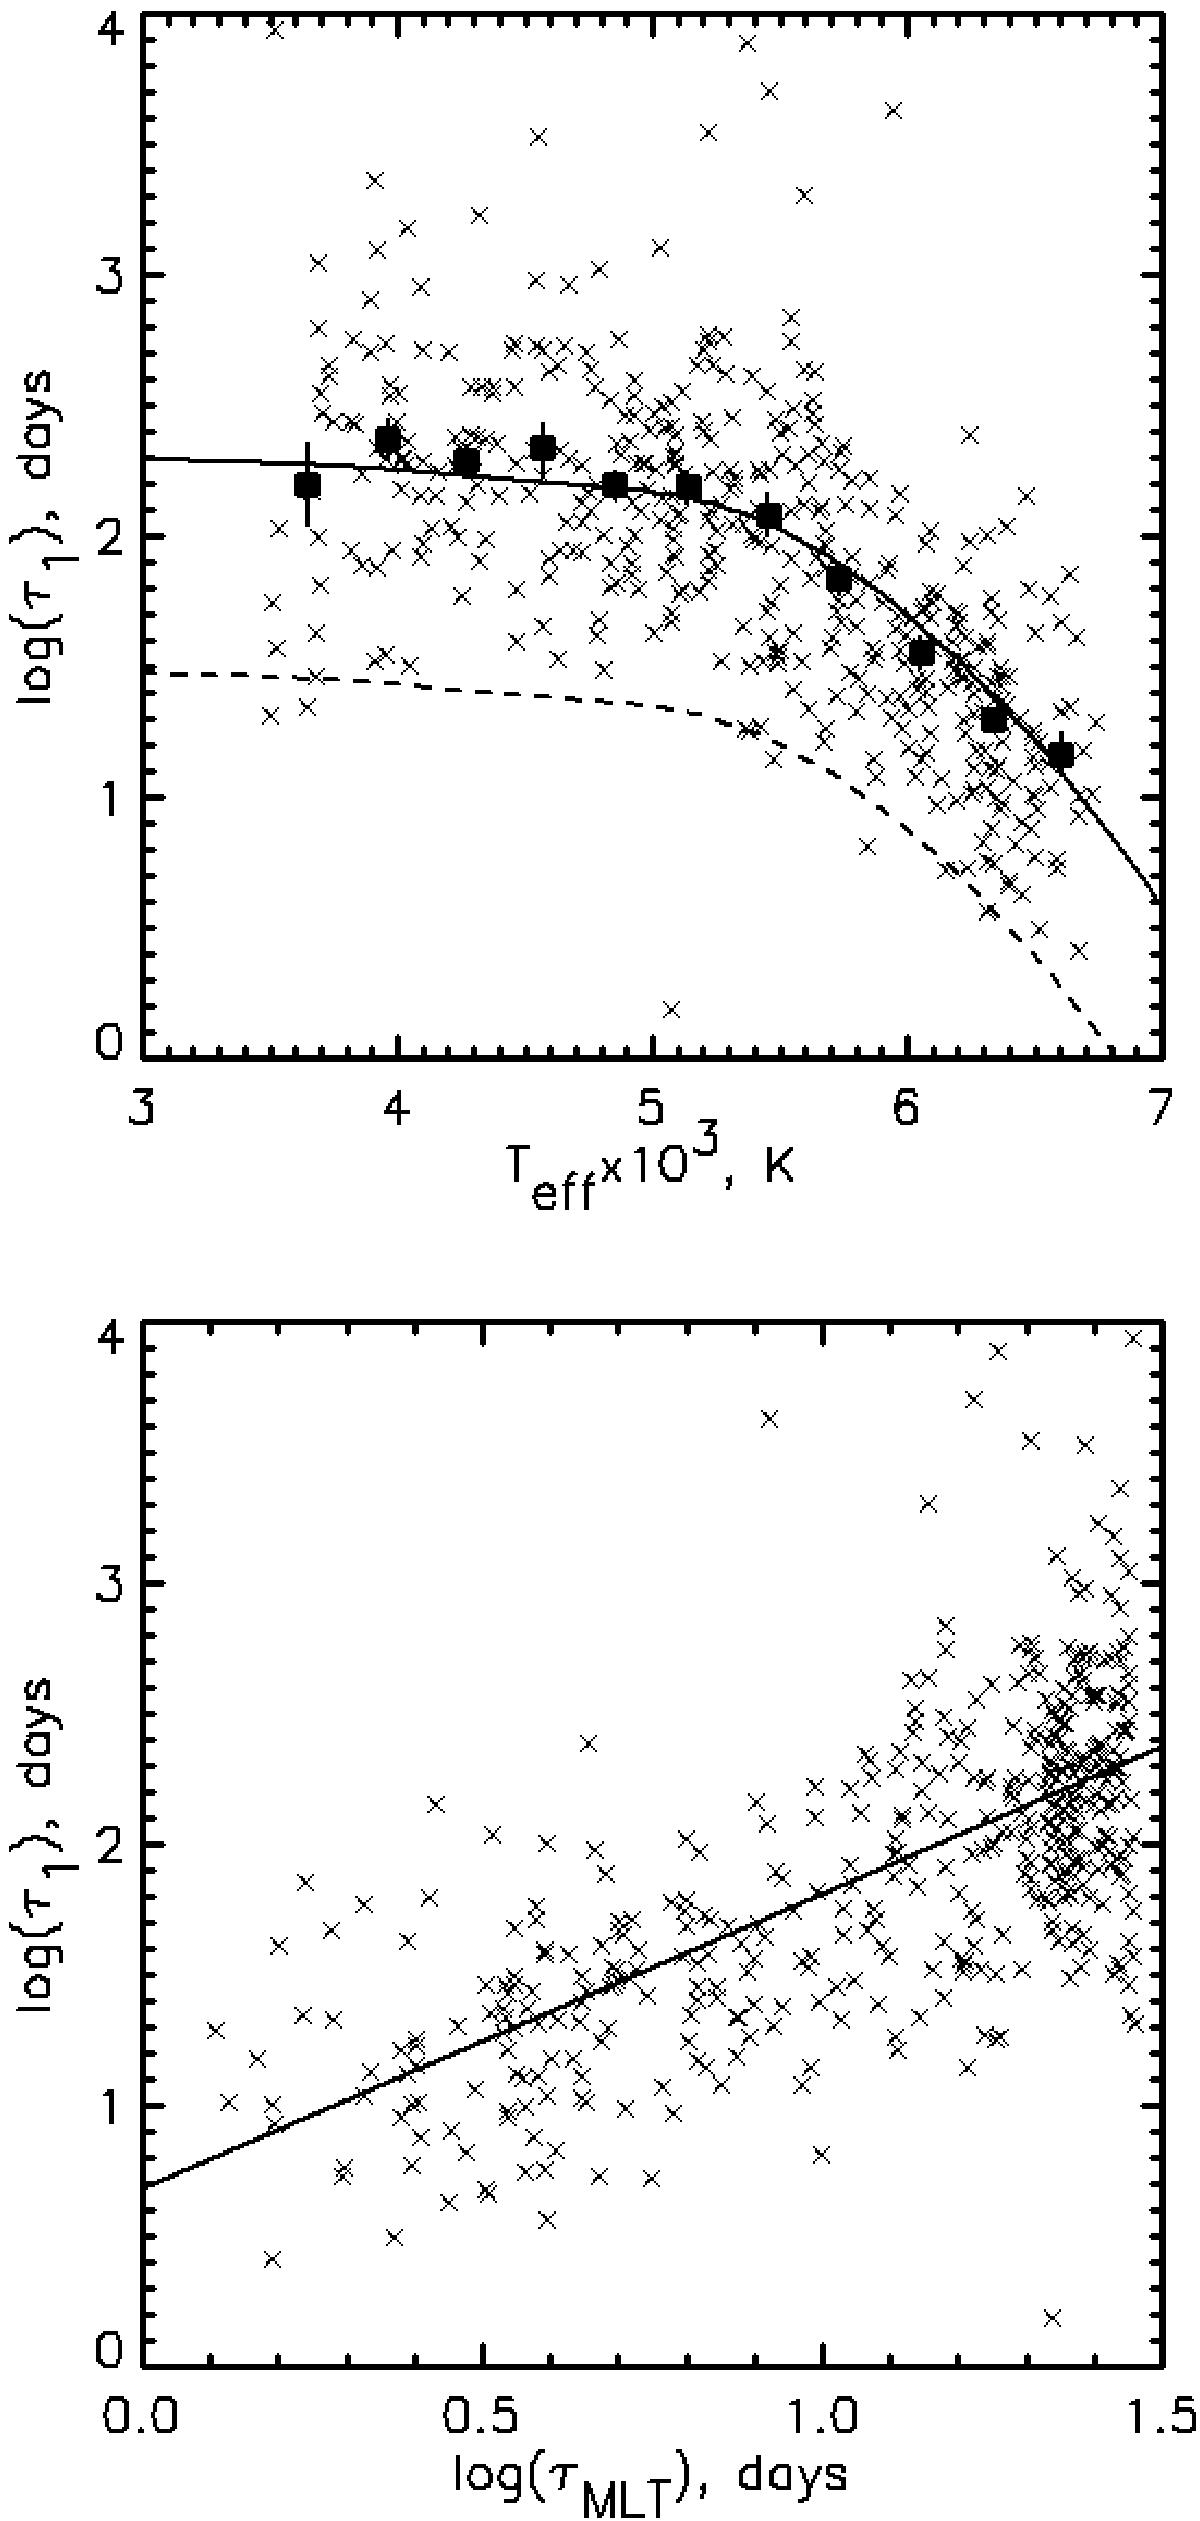
Experimental estimates of τ1 are compared with the model τMLT (Noyes et al. 1984). Top panel: relation of individual estimates of log (τ1) (crosses), their average values in the 300 K-intervals of Teff (squares with error bars), and log (τMLT) (dashed curve) with stellar effective temperature Teff. The solid line of log (τMLT) + 0.82 well approximates the experimental data. Bottom panel: comparison between log (τ1) and log (τMLT) shows a near-linear relation. The slope of the linear regression line (solid) is 1.13 ± 0.06.
Current usage metrics show cumulative count of Article Views (full-text article views including HTML views, PDF and ePub downloads, according to the available data) and Abstracts Views on Vision4Press platform.
Data correspond to usage on the plateform after 2015. The current usage metrics is available 48-96 hours after online publication and is updated daily on week days.
Initial download of the metrics may take a while.