Fig. 7
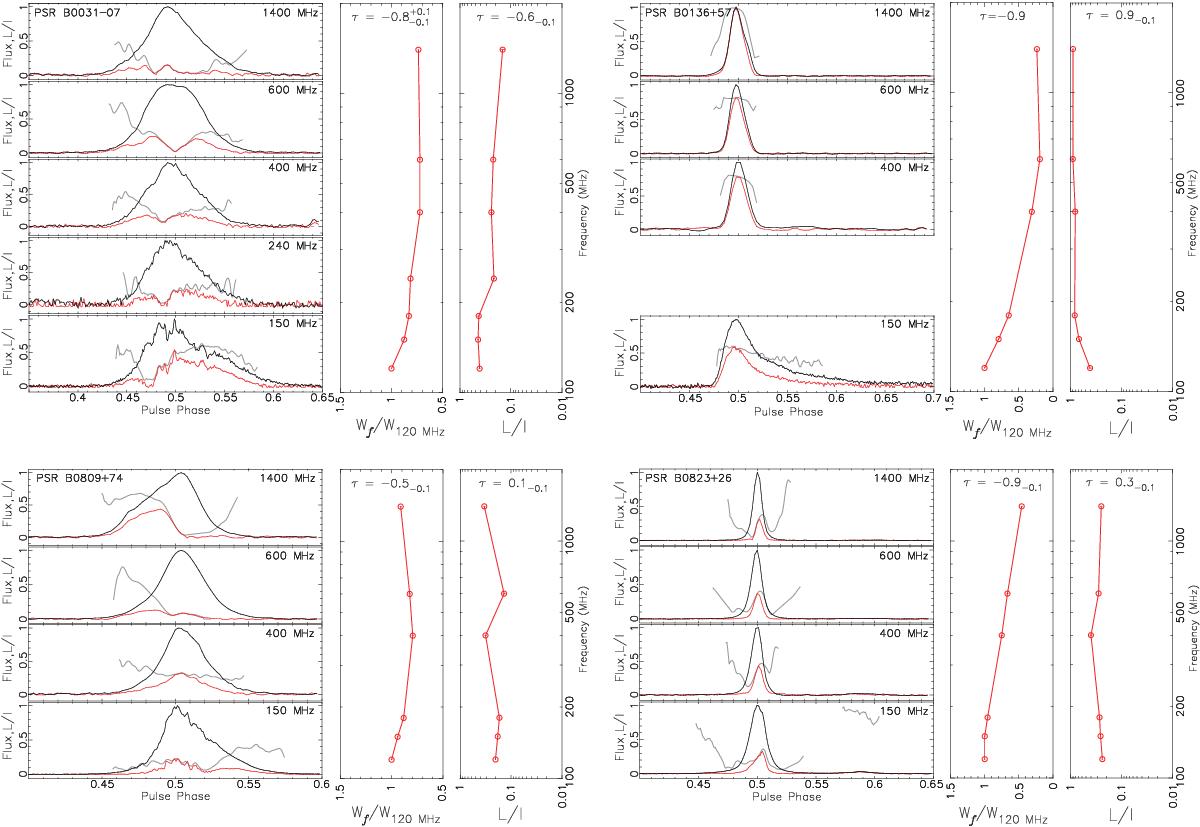
Profiles of the total (black lines) and linearly polarised intensity (red lines) at 150 MHz, from this work, and at 400, 600, and 1400 MHz, from archival observations with the Lovell telescope, for each of the 16 non-recycled pulsars studied in this paper. The fraction of linear polarisation (L/I) as a function of phase is shown with grey lines. The L/I profiles have been smoothed in phase using the method described in 6.3. All profiles have been roughly aligned in phase. Where available, the profile at 240 MHz from archival observations with the GMRT is also shown. The profile of PSR B1237+25 at 1400 MHz came from observations with Arecibo (Rankin, priv. comm.). The pulse width, normalised by its value at 120 MHz (Wf/W120 MHz), and the fraction of linear polarisation (L/I) are plotted as a function of observing frequency alongside the profiles. For the purpose of increasing the information on the frequency evolution of the pulse width and the polarisation fraction, the LOFAR band has been split into three 30 MHz subbands. In those plots we show the value of Kendall’s τ, which is a measure of the correlation (positive value) or anti-correlation (negative value) of the plotted quantity with observing frequency. The asymmetric uncertainties on τ have been derived from a large number of Monte Carlo realisations of the data, assuming Gaussian statistics; only uncertainties of ≥ 0.1 are shown. For PSR B0950+08, the 3 distinct components seen in the linear polarisation profile are marked with letters L, C and T, corresponding to the leading, central and trailing component, respectively. At 1400 MHz, component L is very weak at the phase where it is clearly visible at 600 MHz (marked with grey for reference). Above each flux-density profile of PSR B0950+08, also shown is the corresponding PA profile to aid the discussion in Sect. 8.1.
Current usage metrics show cumulative count of Article Views (full-text article views including HTML views, PDF and ePub downloads, according to the available data) and Abstracts Views on Vision4Press platform.
Data correspond to usage on the plateform after 2015. The current usage metrics is available 48-96 hours after online publication and is updated daily on week days.
Initial download of the metrics may take a while.